July and August 2020 Job Disruptions Update: Improvement Slowing
The August 2020 Bureau of Labor Statistics’ jobs report (that is, the Employment Situation news release) shows that from mid-June to mid-August, U.S. labor market conditions improved more slowly than in the past two months. This post presents my quick parsing of the report. Because I did not post analysis of July’s release, this disruption analysis examines the two-month change from June to August. A later post will examine differences by gender and race.
A post in March explained why the jobs reports are so influential and what indicators I track to understand the impact of COVID-19. Also, see updates for April, May and June. I do not repeat that background here.
Data quality is good.
The Bureau of Labor Statistics reported no new data collection or quality issues. The bureau’s accompanying statement documents the ongoing COVID-related methodological issues and how it managed them.
- Integrity: I see no indication of any attempt, successful or not, to manipulate these data. See my explainer about bureau data integrity practices.
- Misclassification in the household survey: Since March, the Bureau of Labor Statistics has noted that the true unemployment rate is likely higher than the official rate because many workers who respond that they are employed, but not at work, are really on temporary layoff. See questions 5-9 of the statement and my previous discussion. This problem persisted in August, albeit abated. The bureau estimates that correcting the errors would have a maximum impact of adding 0.7 percentage points on the unemployment rate.
- Response rates: Pandemic-related disruptions lowered response rates for the household survey (see questions 1 and 3 of the statement, respectively) although there was some improvement over month. Payroll survey response rates have returned to normal.
The labor market slump is still very deep; the consequential rebound achieved since May is clearly slowing.
- Payroll jobs increased by 1.4 million in August, about 6 percent of the 22.1 million jobs lost in March and April, a slowing from July’s gain of 1.7 million jobs. As of August, 48 percent of March and April’s job losses have been regained. Without the 238,000 temporary hires for the decennial Census, 1.1 million jobs were gained. A subsequent post will examine the payroll survey more closely.
- The official unemployment rate declined to 8.4 percent. The bureau estimates that had there been no misclassification, the official unemployment rate might be as high as 9.1 percent.
- The employment-to-population ratio rose to 55.1 percent as some workers returned to the labor force, although it remains far below February’s ratio of 61.1.
- The labor force participation rate, which was 63.3 percent in February, rose to 61.7 percent in August.
- The labor underutilization rate “U6” declined to 14.2 percent. In February, the U6 was just 7.0 percent. U6, the agency’s broadest measure of labor underutilization, counts as underutilized all workers who are unemployed or working part-time involuntarily, plus those who have left the labor force, but still want a job and have looked for one or worked during the last 12 months.
My COVID-19 disruption table (see below) adds up six distinct ways the crisis has disrupted (suspended or curtailed) the jobs in the U.S. labor market. I use it to track the rebound and the status of the remaining disrupted workers.
- The indicators. Since disruptions can take many forms, I track these indicators:
- Employed workers not at work—workers on leave from their employer, whether paid or not (for illness, family reasons, vacation, etc.—the bureau believes that many of these are misclassified workers actually on temporary layoff, see the bullet on misclassification above).
- Workers part-time for economic reasons—workers who prefer to work full-time but only found a part-time job or who usually work full-time but had their hours reduced by their employer
- Unemployed workers on temporary layoff (furloughed)—laid-off workers who expect a recall
- Unemployed workers not on temporary layoff—includes workers permanently laid off, new and re-entrants and job leavers
- People out of the labor force who currently want a job—people without a job who are not looking for work, but say they want a job
- People out of the labor force who do not want a job—largely students, retirees and people with disabilities or caring for family members
This measure of COVID-19 disruptions is simply the change in the number of workers in each category since February. The first three categories capture workers whose relationships with an employer are intact despite disruptions, in contrast to the latter three. See here for why that matters. (Note: I use seasonally unadjusted data, for comparability.)
-
July and August rebound. By this metric, the number of disrupted workers declined by about 6.1 million from June to August. The first two columns of the table show how much the rebound in July and August affected each type of disruption. About 72 percent of July-August rebound took the form of 4.4 million fewer workers on temporary layoff. This likely reflects recalling workers from temporary layoff (the encouraging reason) or the conversion of temporary layoffs to permanent ones (the concerning reason). Another sizable improvement was 1.8 million fewer people working part-time involuntarily.
Meanwhile, a change in the intentions of workers out of the labor force as the result of COVID-19 suggests potential trouble. Over these two months, the number who say they want a job decreased by almost as much (1.4 million) as the number who said they did not want a job increased (1.7 million). This is problematic if it means that we face a long-term decline in labor force participation going forward.
In addition, about 100,000 workers joined the ranks of the unemployed who are not on temporary layoff. The rise in this category reflects more people actively looking for work in August. Some may be returning to the labor force from the sidelines, others may be newly laid-off or reflect conversions of temporary layoffs to permanent ones.
Finally, the two million decline in the people with a job, but not at work, may reflect seasonal patterns that we do not control for here or continuing improvements in reducing misclassifications.
-
Status of disruptions. The third and fourth columns of the table show that by mid-August, COVID-19 was still disrupting the jobs of over 18 million workers, or about 11 percent of the labor force. Only 7.5 million (around two-fifths) of those workers are classified officially as unemployed. Thus focusing solely on changes in the unemployment rate understates the severity of the disruptions caused by COVID-19.
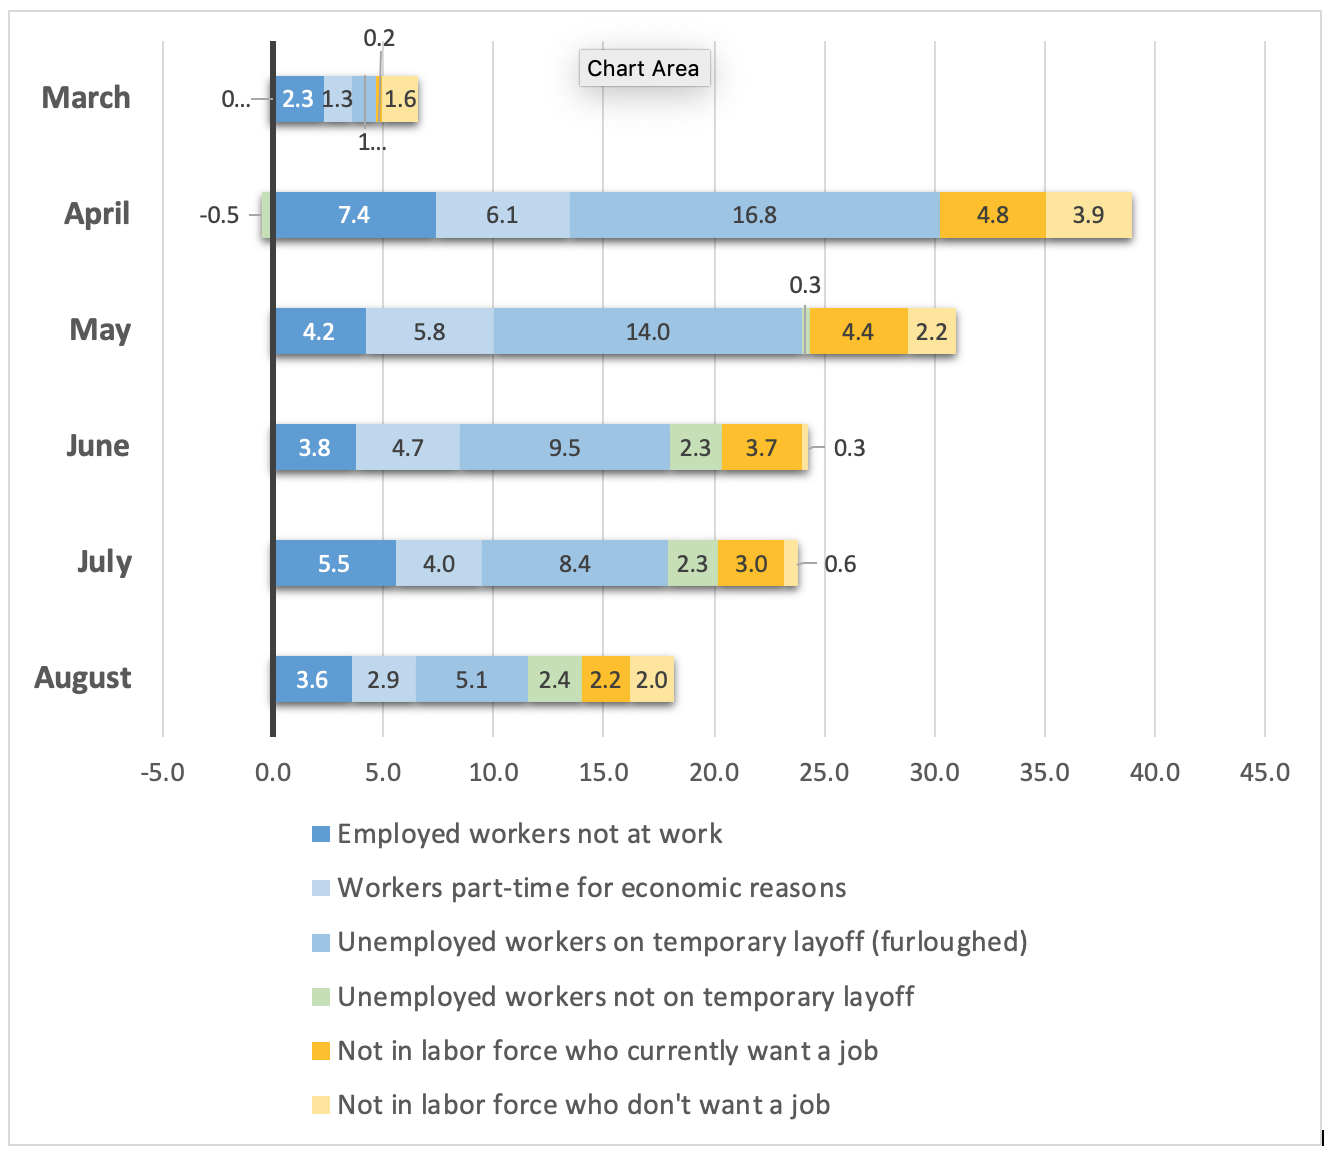
The bar chart shows how the number of workers in the various disruption categories have changed each month from March to August.
The good news is that the scale of disruptions has declined markedly since April, when they affected 38 million workers (23 percent of February’s labor force). From April to June, disruptions shrank to 24 million, a reduction of 14 million.
However, as we note above, the past two months have reduced disruptions by six million, less than half the improvement in the previous two months. Thus, the pace of recovery has certainly slowed.
It is also concerning that fewer workers whose jobs have been disrupted are still connected to an employer. In August, 64 percent of disrupted workers maintain such a tie (shown in the blue segments of the bars)—down from 79 percent in April.
Implications for the future
This analysis can be summarized with four points.
First, the condition of the labor market remains dire. Indeed, looking only at changes in unemployment understates the scale of COVID-19 job disruptions by at least half. A broader look indicates that COVID-19 disruptions are still affecting eleven percent of the labor force. Since February, considerably many more workers have moved into other disrupted states (employed but not at work, involuntary part-time and out of the labor force) than joined the ranks of the officially unemployed.
Second, the pace of the jobs recovery has slowed markedly since June. This likely reflects fewer reopenings, some reversals, along with mounting recessionary influences (from bankruptcies, delinquencies and cautionary behavior on the part of consumers, state and local governments, companies and investors).
Third, the share of maintained relationships with employers in these disruptions is declining, dimming prospects for further rapid recovery. Initial unemployment insurance claims continued to be historically high through September, as recession influences have deepened. Now, in contrast to April (when only a fifth of disrupted workers disconnected from their employers), more than one third of the workers whose jobs are disrupted have been cut loose permanently; they are either searching for a new job or have left the labor force.
Fourth, the composition of labor force exit has changed again—and not for the better. We have returned to the April pattern where only about half of the net increase in workers out of the labor force is due to those who want a job. This could be a signal of a troubling long-term decline in labor force participation due to the pandemic.
In sum, after four months of rebound, improvements are slowing and job market conditions remain very weak. In the context of continuing downside risks (including renewed virus infections, civil unrest, lack of fiscal policy support and slowing trade), policy and effective containment will be very important to support as robust a recovery as possible.
| June to August change | Continuing disruptions (February to August change) |
|||
|---|---|---|---|---|
| Millions of disrupted workers | Share of change | Millions of disrupted workers | Share of disrupted workers | |
| Type of Job Disruption | ||||
| Type of Job Disruption | ||||
| Employed workers not at work | -0.2 | 4% | 3.6 | 20% |
| Workers part-time for economic reasons | -1.8 | 30% | 2.9 | 16% |
| Unemployed workers on temporary layoff (furloughed) | -4.4 | 72% | 5.1 | 28% |
| Unemployed workers not on temporary layoff | 0.1 | -1% | 2.4 | 13% |
| Not in labor force who currently want a job | -1.4 | 24% | 2.2 | 12% |
| Not in labor force who don't want a job | 1.7 | -28% | 2.0 | 11% |
| Total disrupted | -6.1 | 100% | 18.2 | 100% |
| Share of pre-COVID (February 2020) labor force (164.2 million) | -4% | 11% | ||
Source: U.S. Bureau of Labor Statistics (Current Population Survey) and author’s calculations. Not seasonally adjusted.
Source: U.S. Bureau of Labor Statistics (Current Population Survey) and author’s calculations. Not seasonally adjusted. For methods, see this post.