Overview
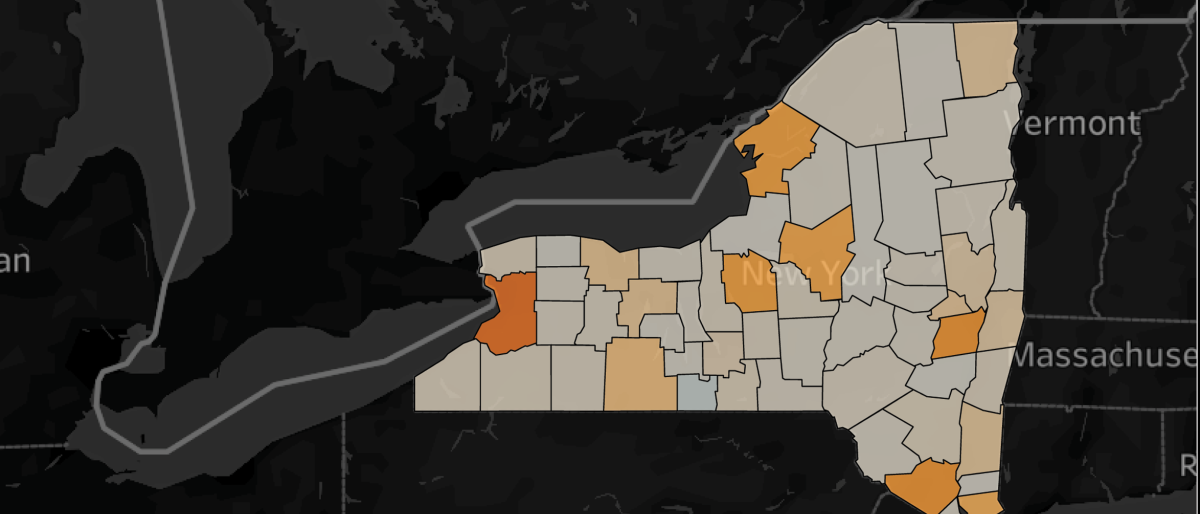
This project, made possible by generous support from New York state and the Community Foundation for Greater Buffalo, seeks to provide New York residents, government leaders and staff, businesses, nonprofits and other stakeholders with data-driven insights on how federal actions in pursuit of government efficiency and domestic economic growth are affecting the state and its diverse geographic areas.
The project will grow as new data and indicators become available and are built into the interactive tools, and the current “Phase 1” version establishes a baseline for tracking trends. For the Phase 1 release, the interactive map compiles New York data in two major topical areas: jobs and federal spending.
Key Findings
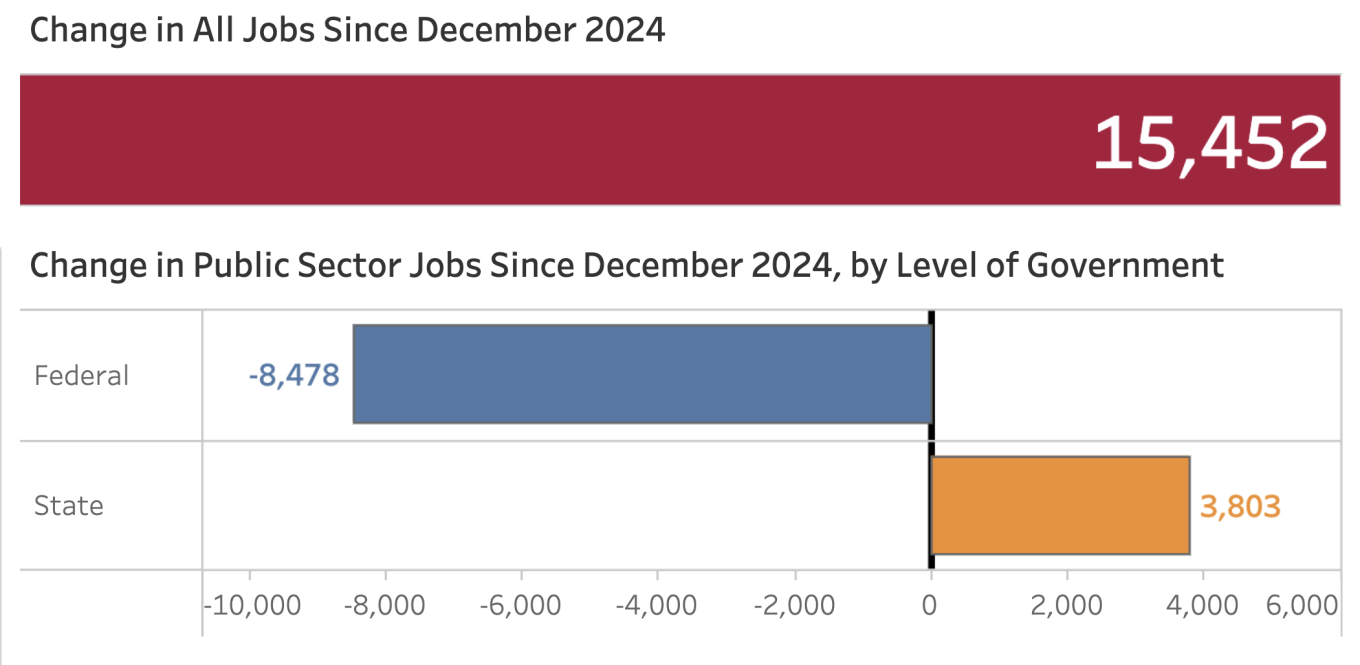
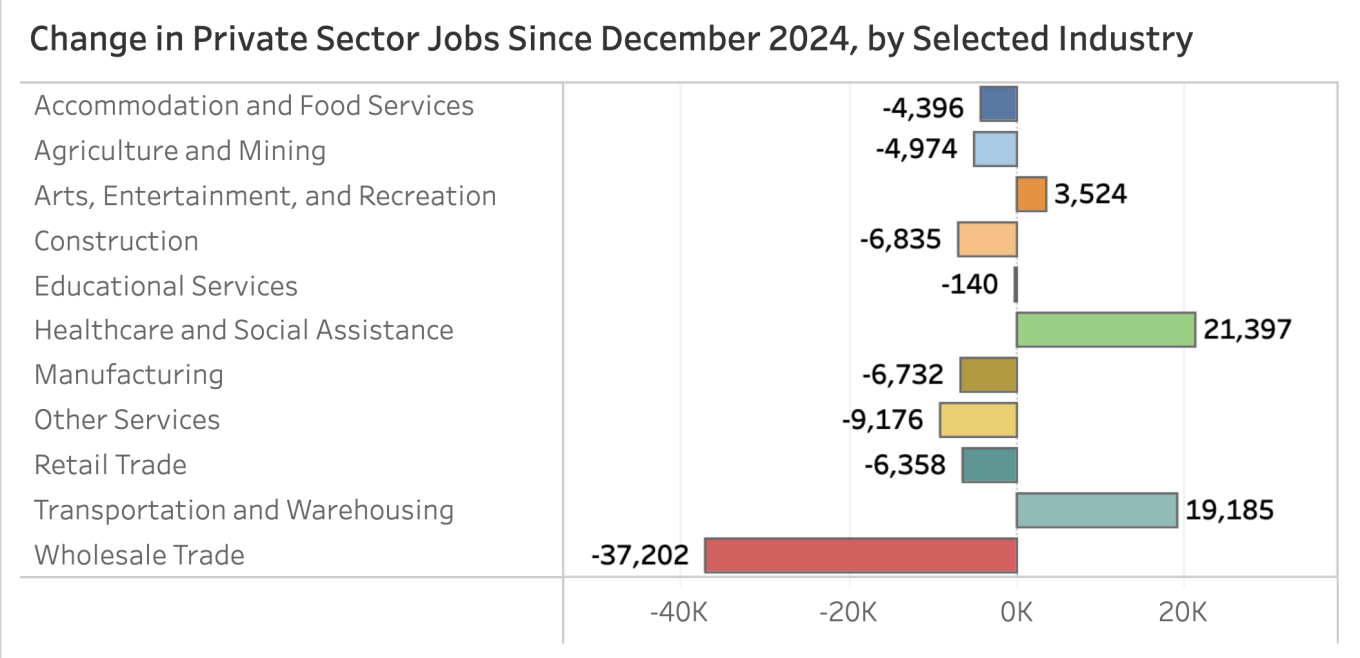
- Between December 2024 and December 2025, New York saw a small net increase in total jobs. However, this net job growth was mostly concentrated in just two industries: healthcare and social assistance, and transportation and warehousing.
- Nearly all other industries have experienced contraction, especially industries with high exposure to newly adopted tariff policies, such as wholesale trade.
- More than 8,000 federal government jobs have been lost on balance.
- Relative to fiscal year 2024, federal grant and assistance spending was down by nearly $7 billion in fiscal year 2025.
- Grants and assistance to individuals – especially in the form of direct payments with unrestricted use – accounted for nearly half ($3.1 billion) of the net decrease.
- During the same year-over-year period, federal contract spending in New York was down by over $8 billion.
- Reduced federal contract spending in New York is cutting off a key source of revenue for many of the state’s minority- and women-owned business enterprises (M/WBEs).
Recommendations
- Revitalize federal data systems and data collection programs that have experienced defunding or disinvestment in recent years.
- Restore crucial federal spending streams.
Research Impact
To date, the NYS Federal Impact Interactive Map has been accessed more than 21,000 times. The Buffalo Co-Lab has demonstrated the map’s tools and key findings to elected officials and staff members in the New York State Senate and Assembly, as well as the governor’s office and multiple local and regional philanthropic networks. The next major update is scheduled for late October 2026.
AUTHORS:
Russell Weaver, Buffalo Co-Lab director of research; Cathy Creighton, Buffalo Co-Lab director

CONTACT:
Cathy Creighton
Director
cathycreighton@cornell.edu
The Buffalo Co-Lab for Economic Development continues to play a leading role in Buffalo’s resurgence with a more equitable economy. By partnering with Western New York businesses, unions, government, education and community organizations, the Buffalo Co-Lab impacts New Yorkers statewide through workplace health and safety programs, economic development and labor research, immersion experiences for students and many other initiatives.