Another Uptick in Weekly UI Claims in New York State as U.S. Claims Fall for Fourth Consecutive Week
As analysts await the April 2020 Employment Situation data release from the U.S. Census Bureau and the Bureau of Labor Statistics (BLS) – scheduled to drop on 8 May 2020 – one of the best real time indicators of COVID-19’s impact on national and state economies has been the number of weekly unemployment insurance (UI) claims made by affected workers. To date, our coverage of these figures has turned up three major themes and conclusions:
-
We are in uncharted territory. Nationally, the number of weekly UI claims peaked at nearly 7 million during the week ending 28 March 2020. Prior to the COVID-19 pandemic, the highest number of weekly claims on record was 695,000, which occurred in the 1980s.
-
Weekly claims numbers have been falling but remain at historic levels. According to data released yesterday by the U.S. Department of Labor (DOL), weekly UI claims from across the nation fell to 3.9 million for the week ending 25 April 2020. That marks the fourth straight decrease in initial weekly UI claims. Still, the most recent 3.9 million figure remains more than 1,200% higher than the 282,000 weekly claims that were made just before COVID shutdowns became widespread (the week ending 14 March 2020). Since 15 March, Americans have made more than 30.3 million initial weekly UI claims. Per the BLS, the size of the civilian labor force in March 2020 was around 162.537 million. In other words, the number of claims made over the past six weeks adds up to roughly 18.6% of the labor force.
-
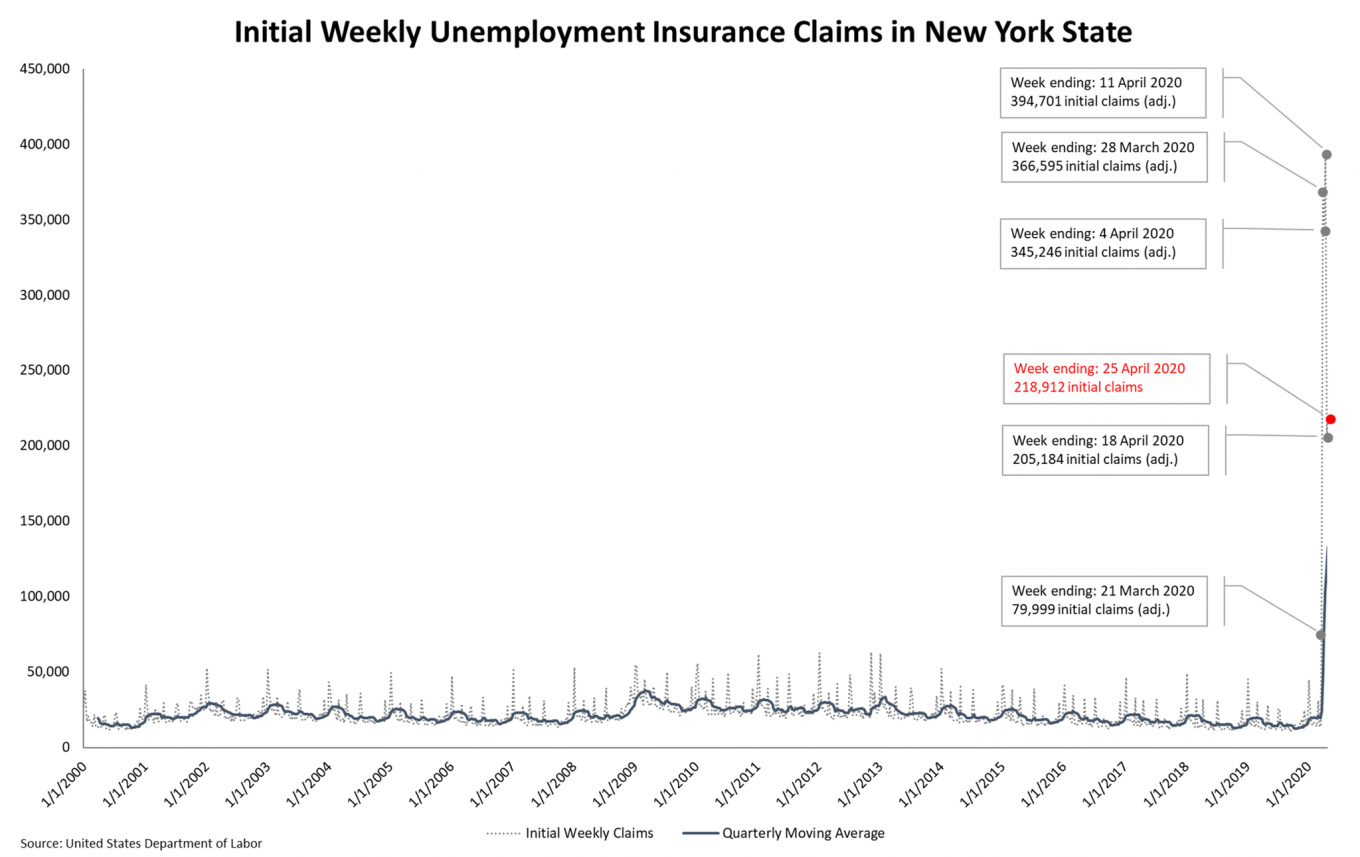
Bucking the national trend, weekly UI claim totals in New York State are still fluctuating up and down. Mirroring the national situation, weekly UI claims in NYS decreased marginally after hitting what was then the state’s peak level during the week ending 28 March 2020. Yet, as U.S. claims fell again the following week, claims in NYS jumped to a new record level for the week ending 11 April 2020. Statewide claims then dropped by nearly 50% a week later. But the state has not experienced the same sustained drop in weekly UI claims that has occurred nationally. To be sure, yesterday’s data show that initial claims in NYS again ticked upward for the week ending 25 April 2020, by 6% relative to the prior week. That brings the six-week total in NYS to over 1.6 million COVID-related UI claims, or roughly 17% of the March 2020 civilian labor force.
Based on these alarming figures (see table below), many experts are anticipating the upcoming Employment Situation data release to show an unemployment rate of over 20 percent. According to some, the current jobless rate may already be near the peak (25.6%) that was reached during the Great Depression. As if that observation weren’t already troubling enough, job losses are expected to continue. As such, more and stronger actions must be taken to provide relief to affected workers and businesses. Recent insights from researchers at the Economic Policy Institute are instructive in this respect:
“The relief and recovery packages passed so far are not big enough to deal with the scale of this crisis, and more aid is crucial. The Congressional Budget Office projects that without additional relief, the unemployment rate will average 16% in the third quarter of this year and 10.1% for the entire calendar year of 2021. One thing the next federal relief and recovery package should do is make additional investments in unemployment compensation, including providing additional funding to states to hire the staff they need to speed up processing and to make improvements to websites and other administrative infrastructure. The UI data show that states don’t yet have what they need to effectively deliver crucial relief to workers and their families.
The next package should also include $500 billion in aid to state and local governments, include provisions to protect workers’ paychecks, include worker safety and health protections, and invest in our democracy. We must also make significant investments in testing and contract tracing because, absent a vaccine or effective treatment for the virus, there is no way we will be able to reopen the economy successfully without an effective system of testing and contact tracing in place. It is likely that with 200,000 contact tracers, we could establish an effective tracing program. The federal government hires half a million temporary workers every 10 years to conduct the decennial census—we could and should do large-scale hiring of public workers for contact tracing. That is one investment that would help not just in controlling the virus and allowing us to reopen earlier, but would also help the workers who would get those jobs, and their families, and therefore help the broader economy.”
| Week Ending | U.S. | % Change from Prior Week | New York State | % Change from Prior Week |
|---|---|---|---|---|
| 21 March 2020 | 3,307,000 | +1,072% | 79,999 | +461% |
| 28 March 2020 | 6,867,000** | +108% | 366,595 | +358% |
| 4 April 2020 | 6,615,000 | -4% | 344,451 | -6% |
| 11 April 2020 | 5,237,000 | -21% | 394,701** | +15% |
| 18 April 2020 | 4,442,000 | -15% | 205,184 | -48% |
| 25 April 2020* | 3,839,000 | -14% | 218,912 | +6% |
| % Change, 14 March 2020 to 25 April 2020 | +1,261% | +1,434% | ||
| % Change COVID-Related Peak** to 25 April 2020 | -44% | -44% | ||
| Total Initial Claims, 21 March – 25 April 2020 | 30,307,000 | 1,609,842 | ||
*Represents initial claims data – subject to adjustment **Indicates peak observed value