
U.S. EMPLOYMENT COST INDEX, Q2 2026 COMMENTARY
2026 Second Quarter Summary – Inflation closes in on compensation cost growth
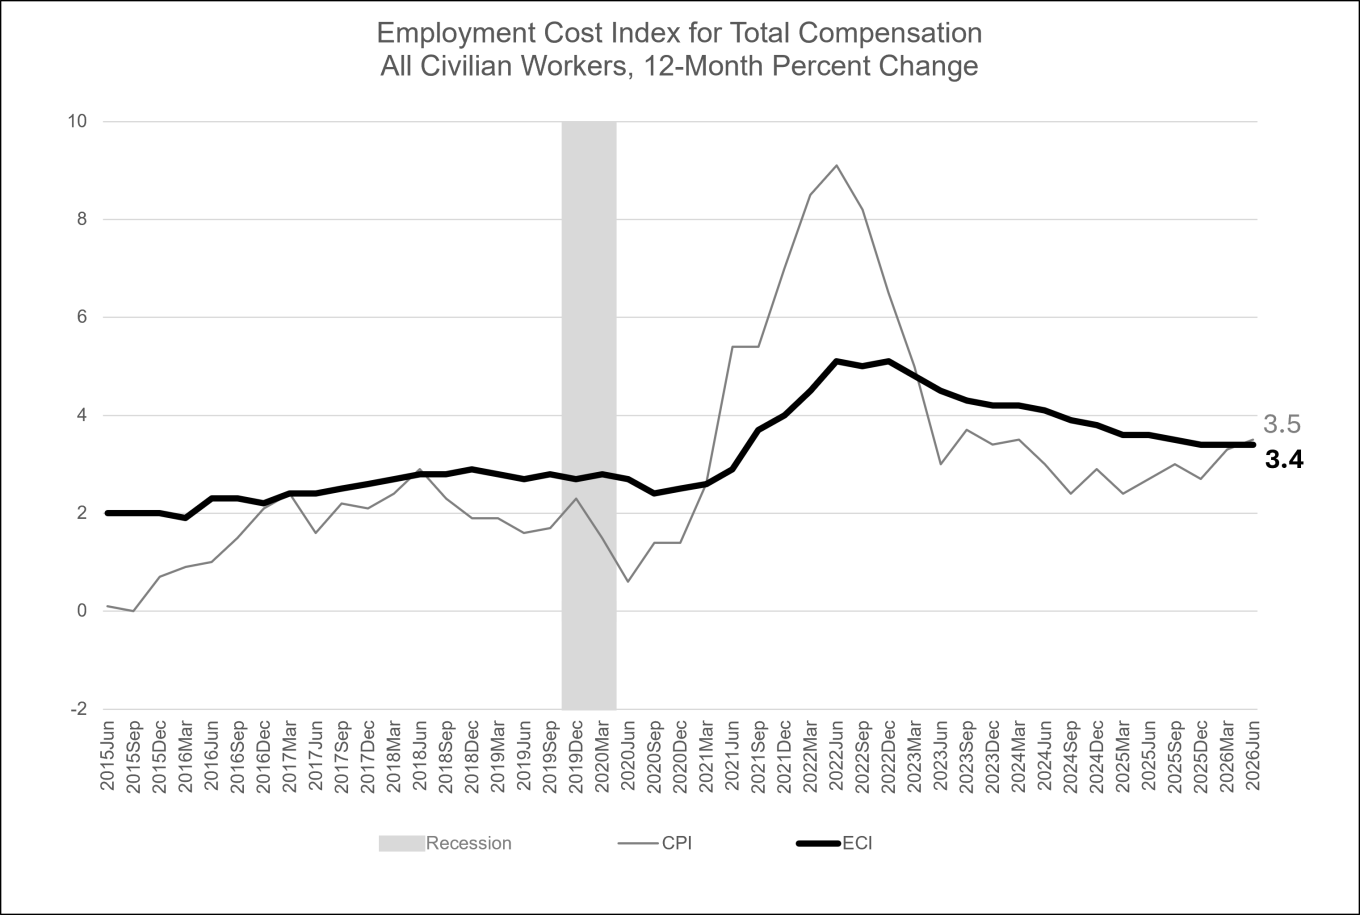
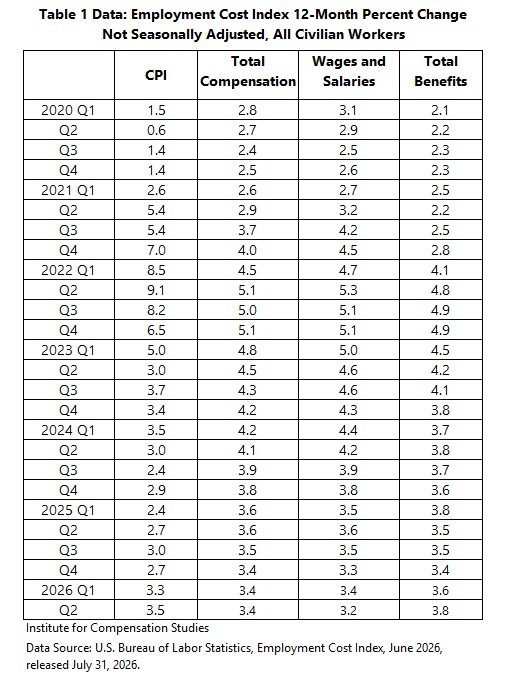
This quarter’s 12-month Employment Cost Index (ECI), released by the U.S. Bureau of Labor Statistics (BLS) on July 31, 2026, held flat at 3.4 percent for the third quarter in a row. This is the first quarter since Q1 2023 that the year-on-year growth rate of employers’ costs for employee compensation was below general inflation. The Consumer Price Index for All Urban Consumers (CPI-U) rose to 3.5 percent over the same 12 months (Chart 1, Table 1). This raises the question: is the labor market beginning another inflation cycle where inflation exceeds wage increases for a period of time until employers adjust pay rate increases in response to labor market forces?
Chart 1 Employment Cost Index for Total Compensation—All Civilian Workers, 12-Month Percent Change
Data Source: U.S. Bureau of Labor Statistics, Employment Cost Index, June 2026, released July 31, 2026.
See Chart 1 Data for Employment Cost Index for Total Compensation for All Civilian Workers, 12-Month Percent Change.
Table 1 Employment Cost Index 12-Month Percent Change—Not Seasonally Adjusted, All Civilian Workers
See Table 1 Data for Employment Cost Index 12-Month Percent Change—Not Seasonally Adjusted, All Civilian Workers.
Wages and salaries versus total benefits
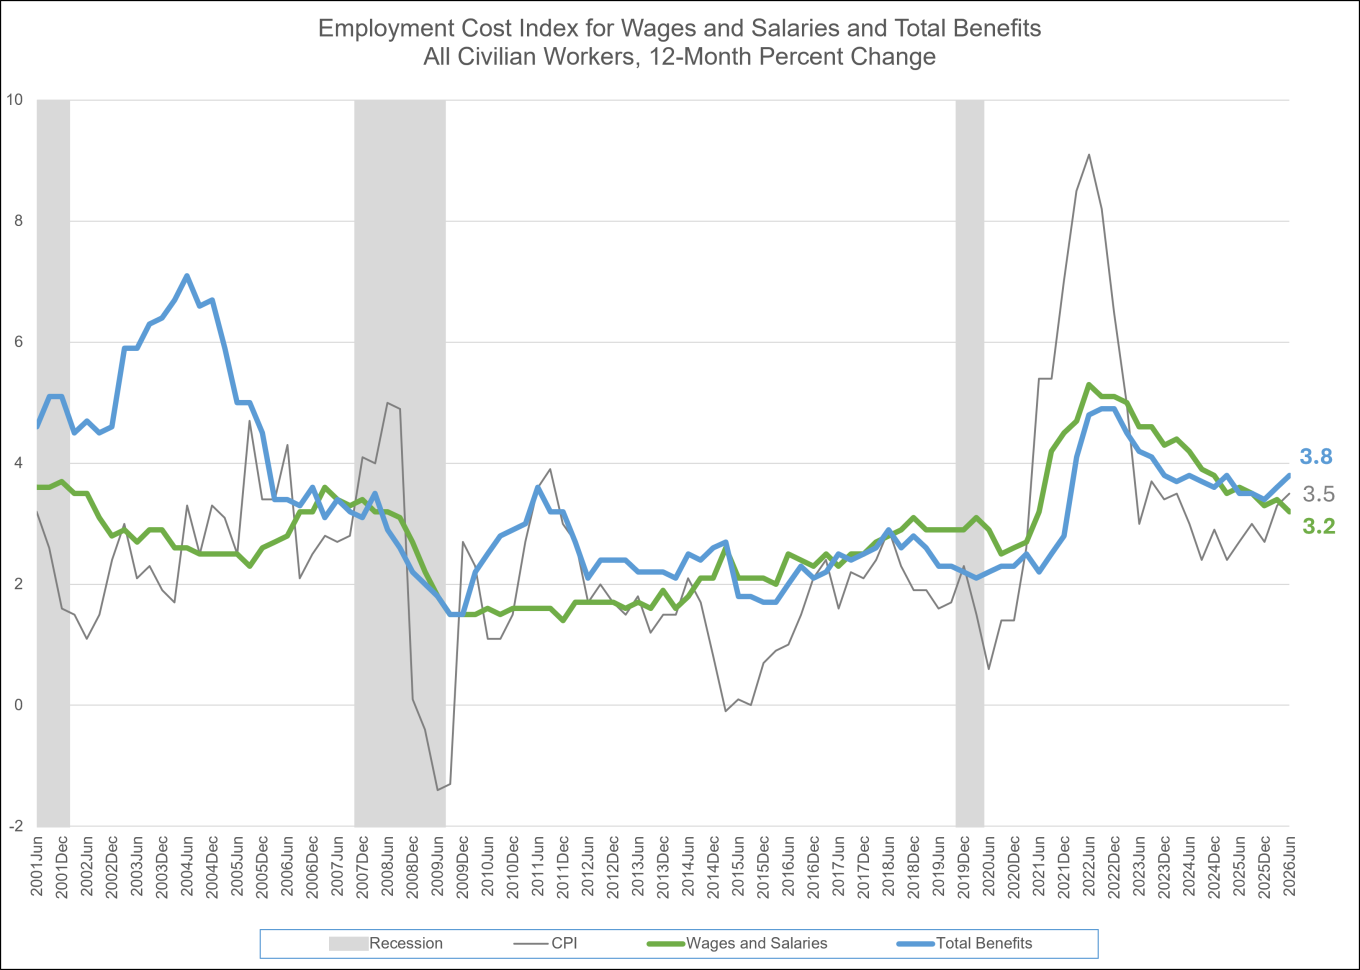
The Q2 year-on-year employer cost index for employee benefits continued to rise. Reported at 3.8 percent this quarter, it exceeds that for wages and salaries by more than half a percent. Employer costs for all civilian worker wages and salaries grew 3.2 percent, below overall inflation (Chart 2).
Chart 2 Employment Cost Index for Wages and Salaries and Total Benefits—All Civilian Workers, 12-Month Percent Change
Data Source: U.S. Bureau of Labor Statistics, Employment Cost Index, June 2026, released July 31, 2026.
See Chart 2 Data for Employment Cost Index for Wages and Salaries and Total Benefits—All Civilian Workers, 12-Month Percent Change.
Union/Nonunion Differences
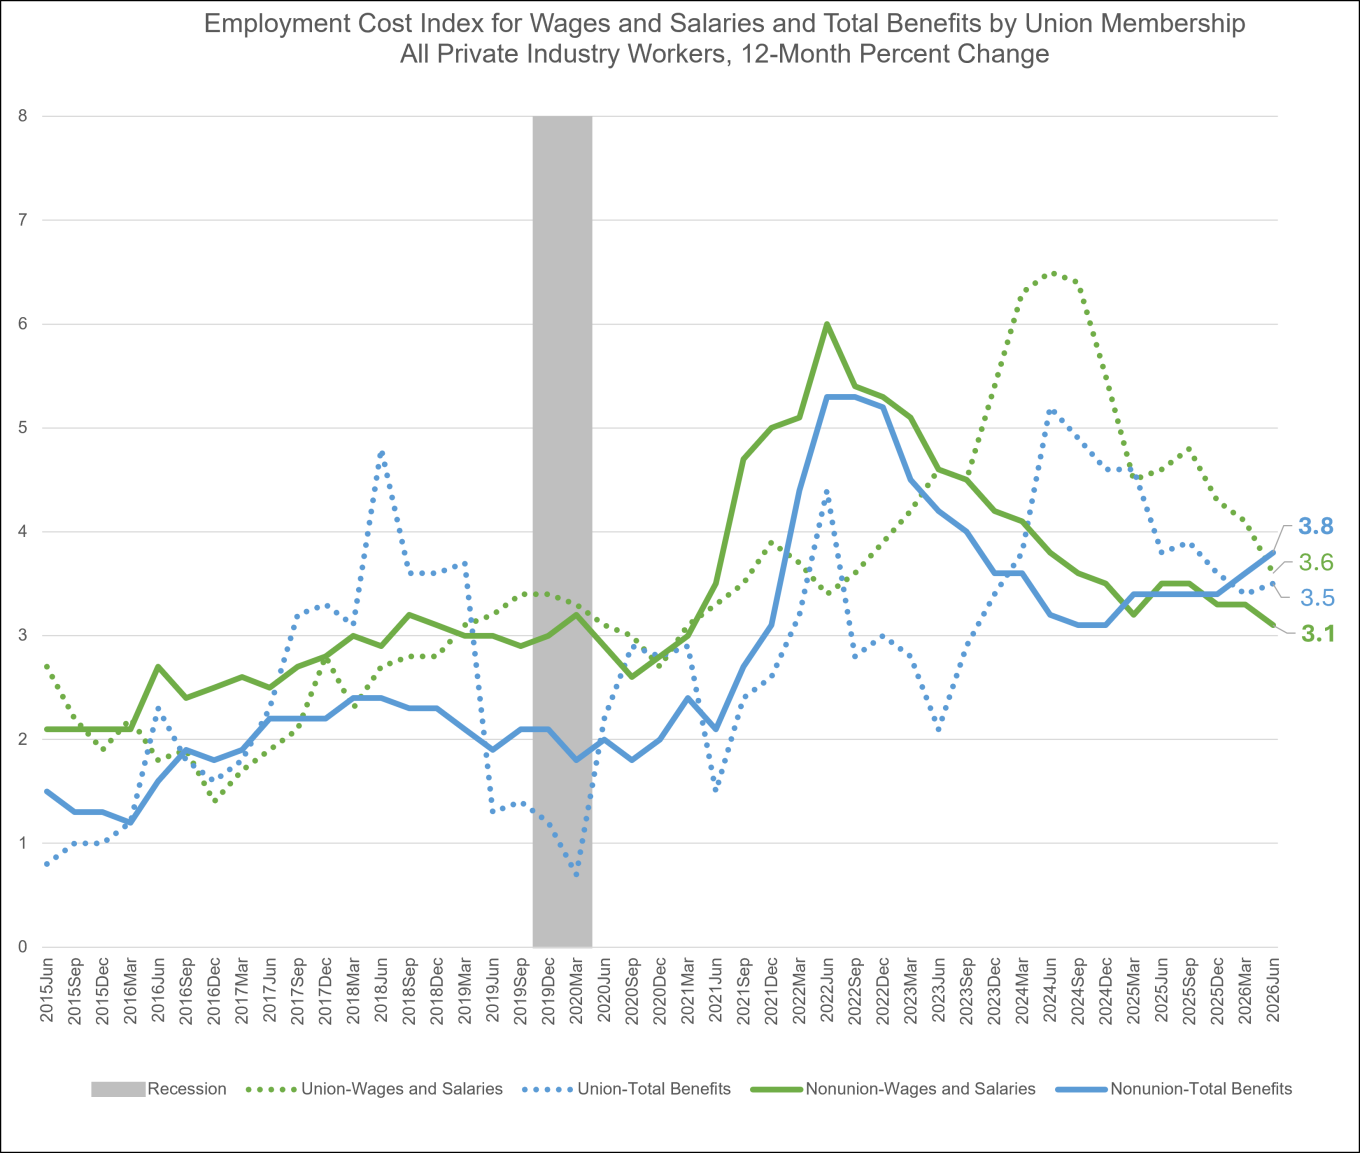
The wage growth premium for unionized workers continued to narrow in the second quarter of 2026. Union wages and salaries decelerated to 3.6 percent on a 12-month basis, down from 4.1 percent in the first quarter (Chart 3), extending a cooling trend from the elevated union wage gains seen in 2023 and 2024, when union contract settlements pushed growth above 6 percent to catch up with earlier private sector wage increases. Nonunion wages and salaries also eased modestly, to 3.1 percent from 3.3 percent, narrowing the union-nonunion wage gap to half a percentage point, from 0.8 percentage point in the first quarter. On the benefits side, the pattern diverged: nonunion total benefits accelerated to 3.8 percent from 3.6 percent, while union total benefits rose only slightly, to 3.5 percent from 3.4 percent — leaving nonunion workers with faster benefits growth than their union counterparts for the first time in recent quarters. Overall, the second quarter reflects a continued convergence between union and nonunion wage growth, even as CPI rose to 3.5 percent from 3.3 percent over the same period.
Chart 3 Employment Cost Index for Wages and Salaries and Total Benefits by Union Membership—All Private Industry Workers, 12-Month Percent Change
Data Source: U.S. Bureau of Labor Statistics, Employment Cost Index, June 2026, released July 31, 2026.
See Chart 3 Data for Employment Cost Index for Wages and Salaries and Total Benefits by Union Membership—All Private Industry Workers, 12-Month Percent Change.
Government and Private Industry Trends
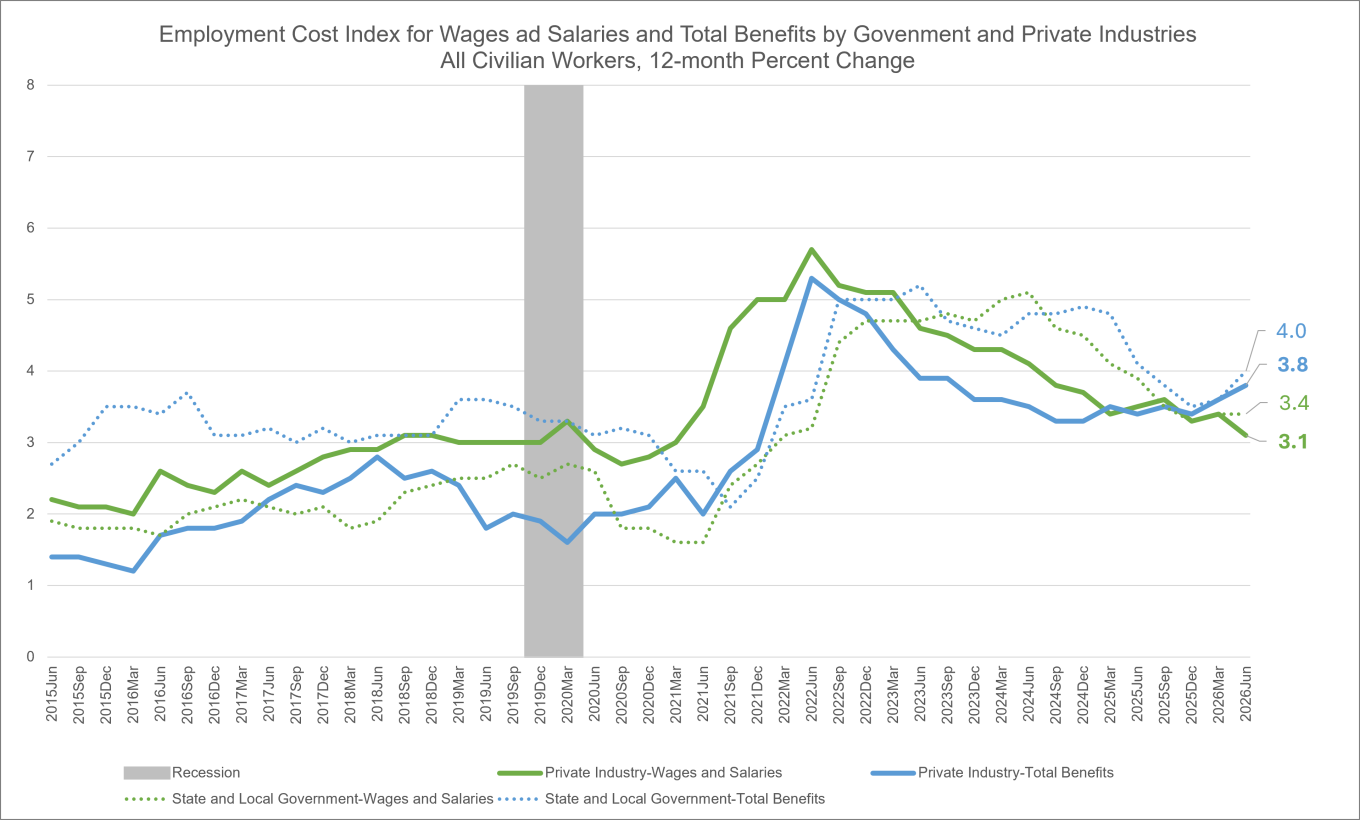
Compensation growth patterns diverged notably between the public and private sectors in the second quarter of 2026, with benefits costs outpacing wages in both. Private industry wages and salaries decelerated to 3.1 percent on a 12-month basis, down from 3.4 percent in the first quarter, even as private industry benefits costs accelerated to 3.8 percent from 3.6 percent (Chart 4). State and local government wages and salaries held flat at 3.4 percent, while state and local government benefits rose sharply to 4.0 percent from 3.6 percent in the first quarter — the largest single-quarter increase among the four series and now the fastest-growing component in the chart. This divergence between wage and benefits growth, most pronounced in the public sector, is consistent with the broader rise in benefits costs — driven in large part by healthcare — noted elsewhere in this quarter's release. Overall, the second quarter reinforces a pattern in which employers across both sectors are absorbing at least part of rising benefits costs as wage growth softens, against a backdrop of CPI rising to 3.5 percent from 3.3 percent.
Chart 4 Employment Cost Index for Wages and Salaries and Total Benefits by Government and Private Industries—All Civilian Workers, 12-Month Percent Change
Data Source: U.S. Bureau of Labor Statistics, Employment Cost Index, June 2026, released July 31, 2026.
See Chart 4 Data for Employment Cost Index for Wages and Salaries and Total Benefits by Government and Private Industries—All Civilian Workers, 12-Month Percent Change.
Total and Healthcare Benefits
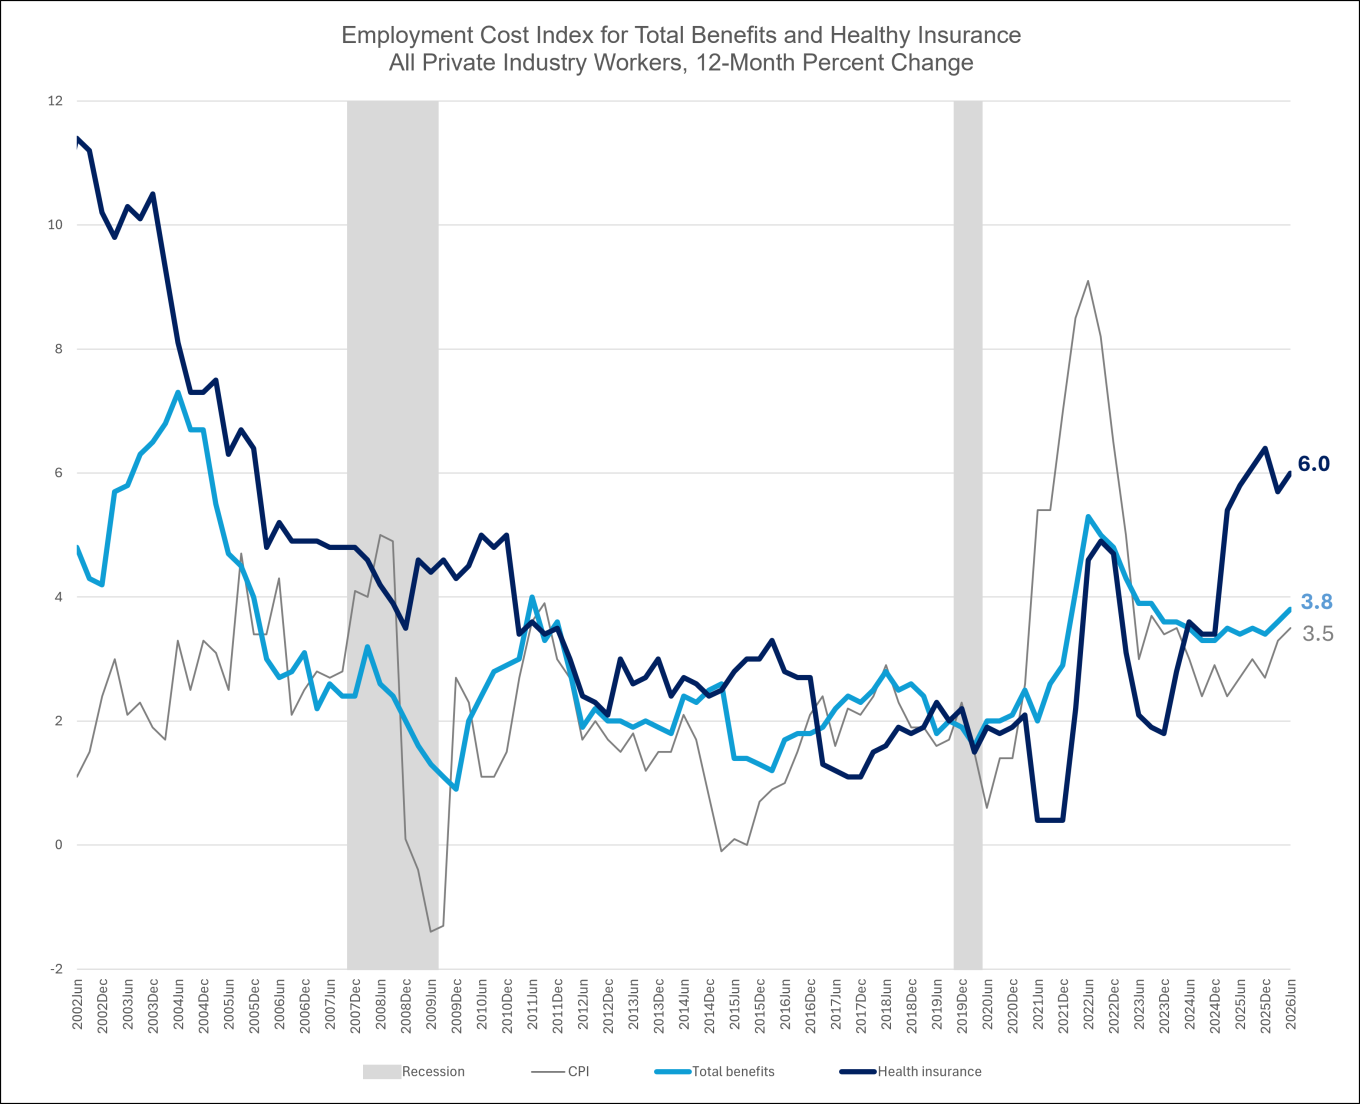
After what appeared to be slowing in the growth rate of employer-provided health insurance costs for private industry workers, year-on-year cost increases accelerated again this quarter. For the twelve months ending in June, private sector health insurance costs rose 6.0 percent, more than two percentage points higher than ECI for overall benefit (Chart 5).
This raises concern that the modest decline in March 2026 was an exception to the trend of rising acceleration since December 2023, rather than a true indicator of slowing. While still well below the peak acceleration rates of the early 2000s, it has been some 20 years since employers faced employee healthcare costs rising this quickly.
What is driving this? A number demand-side factors have coincided and accelerated recently, some longer-term and some shorter. The workforce is aging, which correlates with greater healthcare needs. Employees are also using more expensive products and services, including use of costly drugs (such as GLP-1s and new treatments for cancer and chronic conditions). Reductions on federal tax subsidies for individual insurance policies may also increase use of employer-provided programs for family members.
Costs of supplying healthcare and insurance are also rising. The ECI for wages and salaries saw a 12-month increase of 3.6% for the health care and social assistance industry, notably higher than the 3.1% for overall service providers. Lower immigration, labor shortages, and a limited scope for improving productivity in the labor-intensive parts of health care all contribute to supply-side cost pressures. Insurance companies’ administrative costs have been rising as health care becomes more complex. Finally, both hospitals and insurance companies have consolidated, which reduces competition in those industries.
Irrespective of cause, as the increase in employers’ costs for healthcare benefits picks up speed, employers will look to make changes to their benefits packages to lessen expenses, such as increasing the share of healthcare premiums that employees pay or cutting back on coverage for more expensive benefits like GLP-1 coverage.
Data Source: U.S. Bureau of Labor Statistics, Employment Cost Index, June 2026, released July 31, 2026.
See Chart 5 Data for Employment Cost Index for Total Benefits and Health Insurance—All Private Industries Workers, 12-Month Percent Change.
Data Notes: The Employment Cost Index (ECI) is produced by the U.S. Bureau of Labor Statistics to measure trends in the costs of compensation paid by employers to their employees, free from the influence of employment shifts among occupations and industries. The ECI is one of the labor market indicators used by the Federal Reserve Board to monitor the effects of fiscal and monetary policies and is released quarterly with a one-month lag.
Data for the Q2 2026 reference period (the 3-months ending in June 2026) were collected from a probability sample of approximately 28,300 occupational observations selected from a sample of about 6,600 private industry establishments and approximately 7,300 occupational observations selected from a sample of about 1,400 state and local government establishments that provided data at the initial interview.
Link to most recent ECI release: https://www.bls.gov/news.release/pdf/eci.pdf.
The Institute for Compensation Studies (ICS) at Cornell University’s ILR School is an interdisciplinary center that researches, teaches and communicates about monetary and non-monetary rewards from work, and how these rewards influence outcomes for individuals, companies, industries, and economies. At the crossroads between scholarship and practice, ICS is an exchange dedicated to helping new knowledge hit its mark in the world of work.
Contact:
Erica L. Groshen
Senior Economics Advisor
Institute for Compensation Studies
Authors:
Linda Barrington, Cornell SC Johnson College of Business
Star Yanxin Gao, Cornell University – ILR School
Erica L. Groshen, Cornell University – ILR School
The Institute for Compensation Studies