


Fourth Quarter of 2020
2020 Fourth Quarter: Annual compensation growth remains steady despite worsening labor market conditions at end of quarter
Civilian workers cost to employers continues slower trend at 2.5 percent growth per year
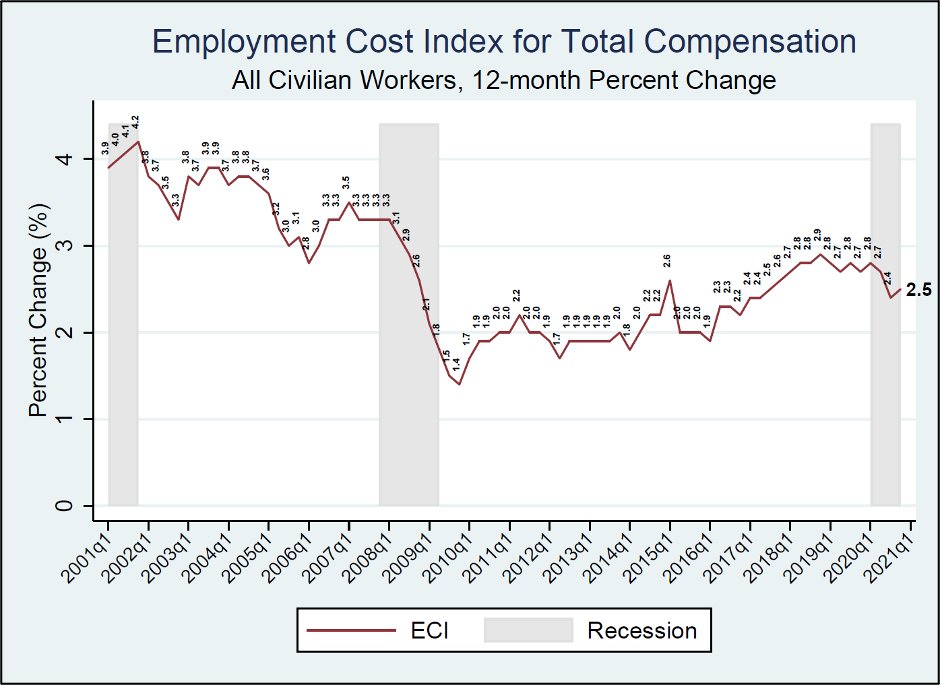
Released January 29 2021, the U.S. Bureau of Labor Statistics’ 12-month Employment Cost Index (ECI) in the last quarter of 2021, was similar to last quarter’s rate, ticking up to 2.5 percent (Chart 1). ECI growth had hovered between 2.7 and 2.9 percent for the 10 quarters (from Q1 2018 through Q2 2020) and decreased to 2.4 percent in September 2020. Prior to that, ECI growth accelerated steady between 2016 Q2 and 2017 Q4.
Chart 1
Prepared by Cornell Institute for Compensation StudiesTM
Data Source: BLS (ECI Historical Listing, January 29, 2021)
2020 Q4 ECI data reflect a weaker labor market
Slower recent ECI growth no doubt reflects softer labor market conditions since the onset of the COVID-19 pandemic. Although payroll jobs have recovered about half of their losses since April 2020, progress has slowed markedly since August, ending with job losses in December.
The recent behavior of ECI highlights the importance of its controls for workforce composition. Looking at the growth of ECI of private sector workers since 2007, we see that ECI earnings usually move apace with the annual growth rate of average weekly earnings (AWE) of private sector workers from the BLS Current Employment Statistics (CES) program (also known as the “Payroll Survey”). The Great Recession (2007-2009), saw a steep decline in both growth rates. Our current labor market crisis is markedly different in that mandated shutdowns and precautionary consumer behavior has caused a sudden and historically large loss of jobs for particular workers at particular employers. The affected workers are disproportionately low-wage workers, which raised the average wage of those workers still employed. In stark contrast, the ECI’s controls for workforce composition reveal that the pace of compensation growth has not increased dramatically (to over 6 percent per year as AWE suggests), but instead has slowed modestly during the pandemic. The next data release (at the end of April) will further add to the picture of what is happening with compensation.
Chart 2

Retrieved from FRED, Federal Reserve Bank of St. Louis; https://fred.stlouisfed.org/graph/?g=qQz5
Data sources: BLS, U.S. Employment and Training Administration
Trends within components of the ECI
Breaking down total compensation into its key components of earnings (wages and salaries) and benefits, total benefits typically account for about 30 percent of employer costs for employee total compensation. Table 1 reports the ECI trends for each of these categories by public and private sector. The recent slower growth in compensation is due to slower earnings growth. Benefits growth continues in the range between 2.1 to 2.3 percent that has prevailed for seven quarters (since Q2 2019). With the exception of only one quarter –Q2 2017—earnings have been growing faster than benefits since Q2 2015. The recent slowdown in wage and salary growth has narrowed the growth gap, but not eliminated it.
The table also shows that the deceleration in public sector wages and salaries (from 2.6 percent in Q2 2020 to 1.8 percent growth in Q3 and Q4 of 2020) is the driver of this difference in trends. So far in this recession, 12-month private sector wages and salaries growth has declined more modestly--from a range between 3.0 and 3.3 percent (from Q3 2018 to Q1 2020) down to 2.7 to 2.8 percent in the last two quarters of 2020.
Table 1
|
Major series of the Employment Cost Index [Percent change] |
||||||
|
Category |
12-month, not seasonally adjusted |
|||||
|
Dec. |
Mar. |
Jun. |
Sep. |
Dec. |
||
|
Civilian workers (1) |
||||||
|
Compensation (2) |
2.7 |
2.8 |
2.7 |
2.4 |
2.5 |
|
|
Wages and salaries |
2.9 |
3.1 |
2.9 |
2.5 |
2.6 |
|
|
Benefits |
2.2 |
2.1 |
2.2 |
2.3 |
2.3 |
|
|
Private industry |
||||||
|
Compensation (2) |
2.7 |
2.8 |
2.7 |
2.4 |
2.6 |
|
|
Wages and salaries |
3.0 |
3.3 |
2.9 |
2.7 |
2.8 |
|
|
Benefits |
1.9 |
1.6 |
2.0 |
2.0 |
2.1 |
|
|
State and local government |
||||||
|
Compensation (2) |
2.9 |
2.8 |
2.7 |
2.3 |
2.3 |
|
|
Wages and salaries |
2.5 |
2.7 |
2.6 |
1.8 |
1.8 |
|
|
Benefits |
3.3 |
3.3 |
3.1 |
3.2 |
3.1 |
|
Footnotes
(1) Includes private industry and state and local government.
(2) Includes wages and salaries and benefits.
Prepared by Cornell Institute for Compensation StudiesTM
Data Source: BLS (ECI Historical Listing, January 29, 2021)
Public sector growth softens more than private sector
The ECI earnings growth deceleration has been steeper for public sector employees, as shown in Table 1 and Chart 3. Before the pandemic, public sector compensation was rising faster than private sector compensation. During the last two quarters, the pattern has flipped. In Q4 2020, 12-month change for public sector workers was 2.3 percent, compared to 2.6 percent for private sector jobs.
Chart 3

Prepared by Cornell Institute for Compensation StudiesTM
Data Source: BLS (ECI Historical Listing, January 29, 2021)
Private sector earnings growth varies widely by occupation
As happened around the 2007 business cycle peak, private sector earnings growth currently varies strongly among occupational groups (see Chart 4). Over the last 12 months, earnings grew slowest (2.0 percent) for professional and managerial occupations and almost twice as fast for service occupations.
Chart 4

Prepared by Cornell Institute for Compensation StudiesTM
Data Source: BLS (ECI Historical Listing, January 29, 2021)
The Employment Cost Index (ECI) released January 29, 2021 by the U.S. Bureau of Labor Statistics reflects trends in the costs to employers for the total compensation, wages, and benefits they provide to their workers, controlling for composition of the workforce. The ECI is one of the labor market indicators used by the Federal Reserve Board to monitor the effects of fiscal and monetary policies and is released quarterly. The BLS summary can be found at https://www.bls.gov/news.release/eci.nr0.htm.


