


2021 First Quarter
2021 First Quarter: Annual compensation growth recovers further from pandemic effects
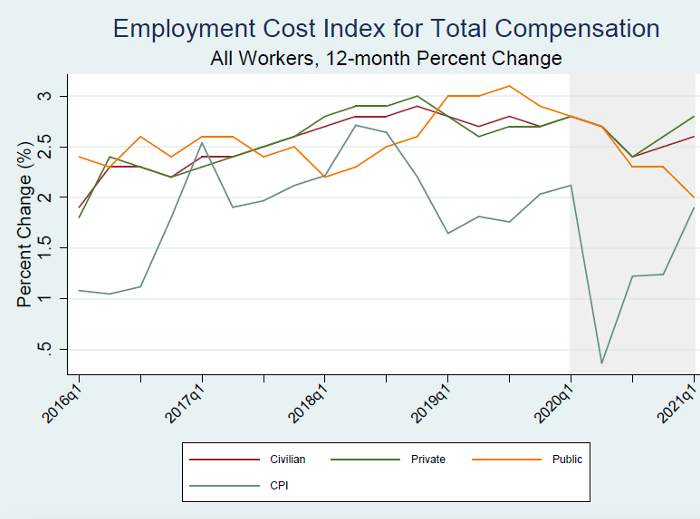
Civilian workers compensation costs 12-month growth rate of 2.6 percent growth per year approaches pre-pandemic trend
Released April 30, 2021, the U.S. Bureau of Labor Statistics’ 12-month Employment Cost Index (ECI) in the first quarter of 2021 ticked up to 2.6 percent (Chart 1). ECI growth had hovered between 2.7 and 2.9 percent for the 10 quarters (from Q1 2018 through Q2 2020) before the pandemic and decreased to 2.4 percent in September 2020. Prior to that, ECI growth accelerated steady between 2016 Q2 and 2017 Q4 as the labor market tightened. Yet, behind this relatively stable trend lies an unusually high degree of variation across occupations.
Chart 1

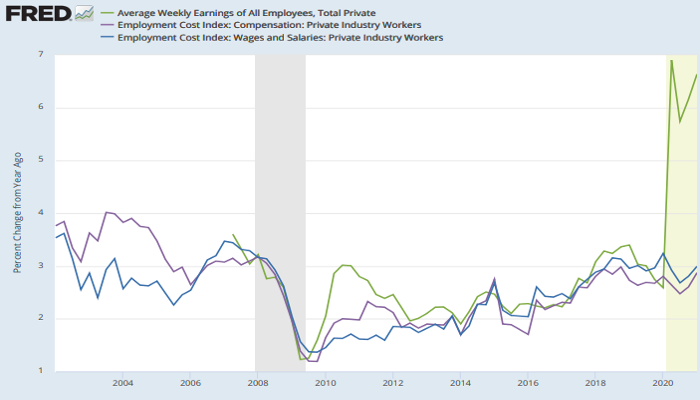
Comparison of 2021 Q1 ECI with average weekly earnings shows impact of lost low wage jobs
The recent behavior of ECI highlights the importance of its controls for workforce composition. Looking at the growth of ECI of private sector workers since 2007, we see that ECI earnings usually move apace with the annual growth rate of average weekly earnings (AWE) of private sector workers from the BLS Current Employment Statistics (CES) program (also known as the “Payroll Survey”). The Great Recession (2007-2009), saw a steep decline in both growth rates. Our current labor market crisis is markedly different in that mandated shutdowns and precautionary consumer behavior caused a sudden and historically large loss of jobs for particular workers at particular employers. Although payroll jobs have recovered more than half of their losses since April 2020, total payrolls jobs are still down about 8.4 million since February 2020. And many workers have had their hours reduced.
The affected workers are disproportionately low-wage workers, which raises the average wage of those workers still employed. In stark contrast, the ECI’s controls for workforce composition reveal that the pace of compensation growth has not increased dramatically (to over 6 percent per year as AWE suggests), but instead slowed modestly during the pandemic.
Chart 2
Retrieved from FRED, Federal Reserve Bank of St. Louis. https://fred.stlouisfed.org/graph/?g=Dzav
Data sources: U.S. Bureau of Labor Statistics, Employment Cost Index and Current Employment Statistics.
Private sector compensation rises slightly while public sector compensation growth slows
Breaking total compensation into its key components of earnings (wages and salaries) and benefits, total benefits typically account for about 30 percent of employer costs for employee total compensation. Table 1 reports the ECI trends for each of these categories by public and private sector. The recent slower growth in compensation is due to slower wage and salary growth. At 2.5 percent over the last 12 months, benefits growth exceeded the range between 2.1 to 2.3 percent that prevailed for seven quarters (since Q2 2019). With the exception of only one quarter –Q2 2017—earnings have been growing faster than benefits since Q2 2015.
The table also shows that public and private sector compensation components moved quite differently over the past year. Public sector compensation took a much larger hit from the pandemic than private sector compensation.
In the private sector, comparing the 12 months ending in March 2020 with the 12 months ending in March 2021, we see slower growth in wages and salaries (down to 3.0 percent from 3.3 percent) offsetting a rise in benefits costs (up from to 2.1 percent to 2.5 percent). Both components rose faster than the rate of inflation in the Consumer Price Index (CPI) over the past 12 months.
By contrast, both components of public sector compensation grew much more slowly in the recent period. Comparing the 12 months ending in March for 2020 and 2021, wage and salary growth declined from 2.8 percent to 2.0 percent and benefits cost growth slowed from 3.3 percent to 2.6 percent. Indeed, comparison with the CPI shows that public sector workers saw almost no growth in their real compensation over the past 12 months.
Table 1
|
Major series of the Employment Cost Index [Percent change] |
|
|||||
|
Category |
12-month, not seasonally adjusted |
|||||
|
Mar. |
Jun. |
Sep. |
Dec. |
Mar. |
||
|
Civilian workers (1) |
||||||
|
Compensation (2) |
2.8 |
2.7 |
2.4 |
2.5 |
2.6 |
|
|
Wages and salaries |
3.1 |
2.9 |
2.5 |
2.6 |
2.7 |
|
|
Benefits |
2.1 |
2.2 |
2.3 |
2.3 |
2.5 |
|
|
Private industry |
||||||
|
Compensation (2) |
2.8 |
2.7 |
2.4 |
2.6 |
2.8 |
|
|
Wages and salaries |
3.3 |
2.9 |
2.7 |
2.8 |
3.0 |
|
|
Benefits |
1.6 |
2.0 |
2.0 |
2.1 |
2.5 |
|
|
State and local government |
||||||
|
Compensation (2) |
2.8 |
2.7 |
2.3 |
2.3 |
2.0 |
|
|
Wages and salaries |
2.7 |
2.6 |
1.8 |
1.8 |
1.6 |
|
|
Benefits |
3.3 |
3.1 |
3.2 |
3.1 |
2.6 |
|
Footnotes
(1) Includes private industry and state and local government.
(2) Includes wages and salaries and benefits.
Prepared by Cornell Institute for Compensation StudiesTM
Data Source: BLS (ECI Historical Listing, April 30, 2021)
Chart 3
Prepared by Cornell Institute for Compensation StudiesTM
Data Source: BLS (ECI Historical Listing, April 30, 2021)
Private sector 12-month wage and salary growth varies widely by occupation
Private sector earnings growth varied strongly among occupational groups (see Chart 4), likely reflecting a high degree of pandemic-related flux in labor supply and demand conditions. Indeed, the standard deviation of growth rates by major occupational group is the highest since this series began in 2001. Over the last 12 months, earnings grew slowest (1.8 percent) for professional and managerial occupations and more than twice as fast for service occupations (4.3 percent) and sales and office occupations (4.4 percent). Among the subgroups reported by BLS, the subgroup showing the highest growth rate is sales and related occupations (6.2 percent). Two subgroups with the slowest growth rates (both at 1.6 percent) were managerial, business & financial occupations and construction, extraction, farming, fishing & forestry occupations.
Chart 4

Prepared by Cornell Institute for Compensation StudiesTM
Data Source: US Bureau of Labor Statistics Employment Cost Index
The Employment Cost Index (ECI) released April 30, 2021 by the U.S. Bureau of Labor Statistics reflects trends in the costs to employers for the total compensation, wages, and benefits they provide to their workers, controlling for composition of the workforce. The ECI is one of the labor market indicators used by the Federal Reserve Board to monitor the effects of fiscal and monetary policies and is released quarterly. The BLS summary can be found at https://www.bls.gov/news.release/eci.nr0.htm.


