


2020 First Quarter
2020 First Quarter: Annual compensation growth remains steady despite worsening labor market conditions at end of quarter
Chart 1

Prepared by Cornell Institute for Compensation StudiesTM
Data source: BLS (ECI Historical Listing, April 30, 2020)
Friday, May 1, 2020
Civilian workers cost to employers increases to 2.8 percent growth per year
Released April 30th 2020, the U.S. Bureau of Labor Statistics’ 12-month Employment Cost Index (ECI) increased slightly in the first quarter of 2020, rising to 2.8 percent (Chart 1). ECI growth has hovered between 2.7 and 2.9 percent for the past 9 quarters. Prior to leveling at this plateau, the ECI growth rate saw steady acceleration between 2016 Q2 and 2017 Q4.
2020 Q1 ECI data tell an incomplete story of our current labor market
The slight acceleration in ECI growth might seem at odds with the current condition of the labor market and the Department of Labor reporting that the advance number for seasonally adjusted insured unemployment reached 17,992,000 during the week ending April 18, 2020. If we look back at growth of ECI of private sector workers, we see it moves in pace with the annual growth rate of average weekly earnings of private sector workers. During the Great Recession (2007-2009), we saw a steep decline in both growth rates while the number of individuals receiving unemployment insurance climbed. It is important to note that both the ECI and earnings growth trends only account for individuals still working. Our current labor market crisis is markedly different in that the mandated shutdown on select businesses has led to a sudden and historic spike in unemployment. The current ECI data only capture 2-3 weeks of the initial effect of the COVID-19 crisis on the U.S. labor market. The next data release at the end of July will provide a more complete picture of what is happening with compensation.
Chart 2

Retrieved from FRED, Federal Reserve Bank of St. Louis; https://fred.stlouisfed.org/graph/?g=qQz5
Data sources: BLS, U.S. Employment and Training Administration
Diverging trends within the components of the ECI
Breaking down total compensation into its key components of earnings (wages and salaries) and benefits, total benefits typically account for about 30 percent of employer costs for employee total compensation. Table 1 reports the ECI trends for each of these categories. While overall ECI for total compensation rose slightly, its components have started to show some diverging trends. Wages and salaries growth sped to 3.1 percent after holding at 2.9 percent for the past year. Total benefits continued its five-quarter run of decelerating growth down to 2.1 percent. Health benefits growth fell by 0.7 percentage points, the largest single-quarter change in that series since 2017 Q1.
Table 1
|
Employment Cost Index for All Civilian Workers, 12-month Percent Change |
||||
|
Period |
Total Compensation |
Wages and Salaries |
Benefits |
|
|
Total Benefits |
Health Benefits |
|||
|
2016 Q1 |
1.9 |
2.0 |
1.7 |
3.3 |
|
2016 Q2 |
2.3 |
2.5 |
2.0 |
2.8 |
|
2016 Q3 |
2.3 |
2.4 |
2.3 |
2.7 |
|
2016 Q4 |
2.2 |
2.3 |
2.1 |
2.7 |
|
2017 Q1 |
2.4 |
2.5 |
2.2 |
1.3 |
|
2017 Q2 |
2.4 |
2.3 |
2.5 |
1.2 |
|
2017 Q3 |
2.5 |
2.5 |
2.4 |
1.1 |
|
2017 Q4 |
2.6 |
2.5 |
2.5 |
1.1 |
|
2018 Q1 |
2.7 |
2.7 |
2.6 |
1.5 |
|
2018 Q2 |
2.8 |
2.8 |
2.9 |
1.6 |
|
2018 Q3 |
2.8 |
2.9 |
2.6 |
1.9 |
|
2018 Q4 |
2.9 |
3.1 |
2.8 |
1.8 |
|
2019 Q1 |
2.8 |
2.9 |
2.6 |
1.9 |
|
2019 Q2 |
2.7 |
2.9 |
2.3 |
2.3 |
|
2019 Q3 |
2.8 |
2.9 |
2.3 |
2.0 |
|
2019 Q4 |
2.7 |
2.9 |
2.2 |
2.2 |
|
2020 Q1 |
2.8 |
3.1 |
2.1 |
1.5 |
Prepared by Cornell Institute for Compensation StudiesTM
Data source: BLS (ECI Historical Listing, April 30, 2020)
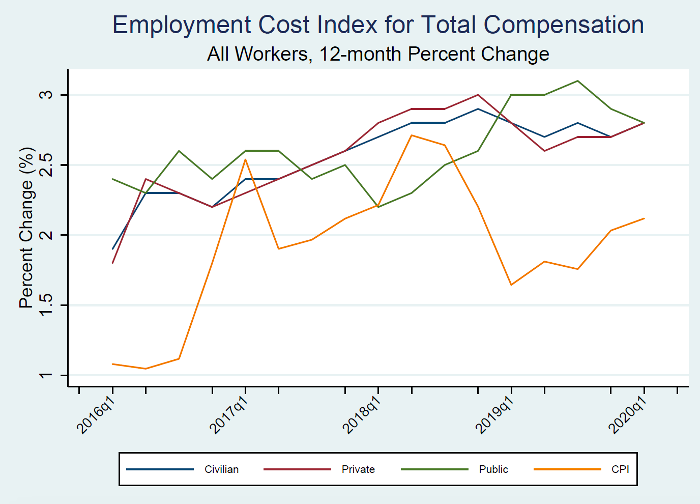
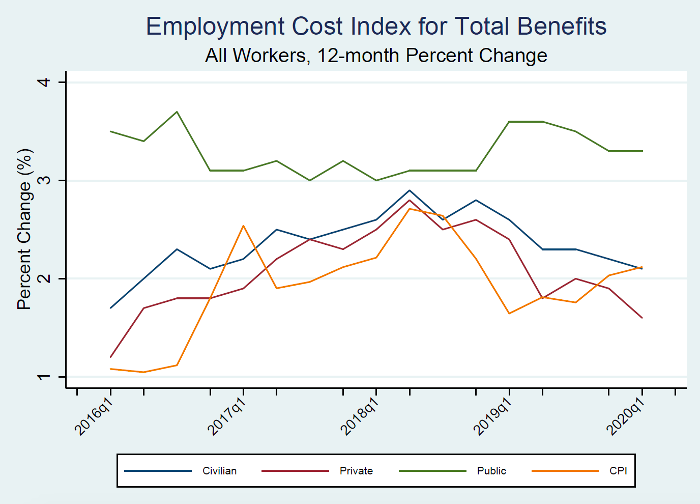
Private sector climbs while public sector growth softens
The acceleration in the ECI for all employees is due to the growth for private-sector employees. Chart 3 shows how the trend in ECI for all civilian workers is driven by the trend for private-sector employees. This relationship is due to the size of the public versus the private sectors. Total compensation growth softened for the public sector, dropping for two consecutive quarters. Chart 4 shows a different set of trends in the ECI for total benefits: public sector employees saw stable growth compared to private sector employees experiencing a deceleration in the ECI for total benefits from 1.9 percent to 1.6 percent.
Chart 3
Data source: BLS (ECI Historical Listing, April 30, 2020)
Chart 4
Data source: BLS (ECI Historical Listing, April 30, 2020)
The Employment Cost Index (ECI) released April 30th 2020 by the U.S. Bureau of Labor Statistics reflects trends in the costs to employers for the total compensation, wages, and benefits they provide to their workers. The ECI is one of the labor market indicators used by the Federal Reserve Board to monitor the effects of fiscal and monetary policies and is released quarterly. The BLS summary can be found at https://www.bls.gov/news.release/eci.nr0.htm.


