


2019 Third Quarter
2019 Third Quarter: Annual compensation growth strengthens, breaking pattern of softening growth over the last two quarters
Chart 1
Prepared by Cornell Institute for Compensation StudiesTM
Data source: BLS (ECI Historical Listing, October 31, 2019)
Friday, November 1, 2019
Civilian workers cost to employers increases to 2.8 percent growth per year
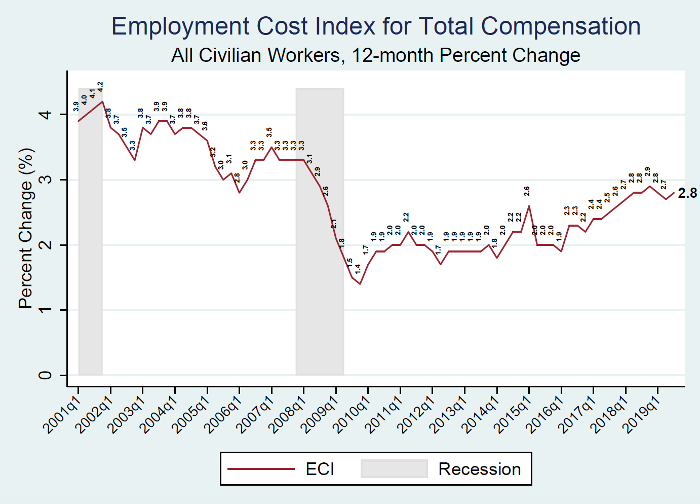
Released October 31st 2019, the U.S. Bureau of Labor Statistics’ 12-month Employment Cost Index (ECI) increased slightly in the third quarter of 2019, rising to 2.8 percent (Chart 1). This increase breaks the recent downward trend in ECI, where the first two quarters of 2019 saw declining inflation. While the ECI has been on average trending upward since the end of the Great Recession, the current growth rate of 2.8 percent still only matches the lowest annual growth rate observed between the end of the 2001 recession and the start of the Great Recession.
Breaking down total compensation into its key components of earnings (wages and salaries) and benefits, total benefits typically account for about 30 percent of employer costs for employee total compensation. Table 1 reports the ECI trends for each of these categories. While overall ECI for total compensation rose slightly, its components held steady at their prior levels. This outcome is likely the result of rounding. Table 1 also highlights that the rapid acceleration in the 12-month health benefit costs seen last quarter fall, returning to its over two year trend of growth not exceed 2.0 percent annually.
Table 1
|
Employment Cost Index for All Civilian Workers, 12-month Percent Change |
||||
|
Period |
Total Compensation |
Wages and Salaries |
Benefits |
|
|
Total Benefits |
Health Benefits |
|||
|
2016 Q1 |
1.9 |
2.0 |
1.7 |
3.3 |
|
2016 Q2 |
2.3 |
2.5 |
2.0 |
2.8 |
|
2016 Q3 |
2.3 |
2.4 |
2.3 |
2.7 |
|
2016 Q4 |
2.2 |
2.3 |
2.1 |
2.7 |
|
2017 Q1 |
2.4 |
2.5 |
2.2 |
1.3 |
|
2017 Q2 |
2.4 |
2.3 |
2.5 |
1.2 |
|
2017 Q3 |
2.5 |
2.5 |
2.4 |
1.1 |
|
2017 Q4 |
2.6 |
2.5 |
2.5 |
1.1 |
|
2018 Q1 |
2.7 |
2.7 |
2.6 |
1.5 |
|
2018 Q2 |
2.8 |
2.8 |
2.9 |
1.6 |
|
2018 Q3 |
2.8 |
2.9 |
2.6 |
1.9 |
|
2018 Q4 |
2.9 |
3.1 |
2.8 |
1.8 |
|
2019 Q1 |
2.8 |
2.9 |
2.6 |
1.9 |
|
2019 Q2 |
2.7 |
2.9 |
2.3 |
2.3 |
|
2019 Q3 |
2.8 |
2.9 |
2.3 |
2.0 |
Prepared by Cornell Institute for Compensation StudiesTM
Data source: BLS (ECI Historical Listing, October 31, 2019)
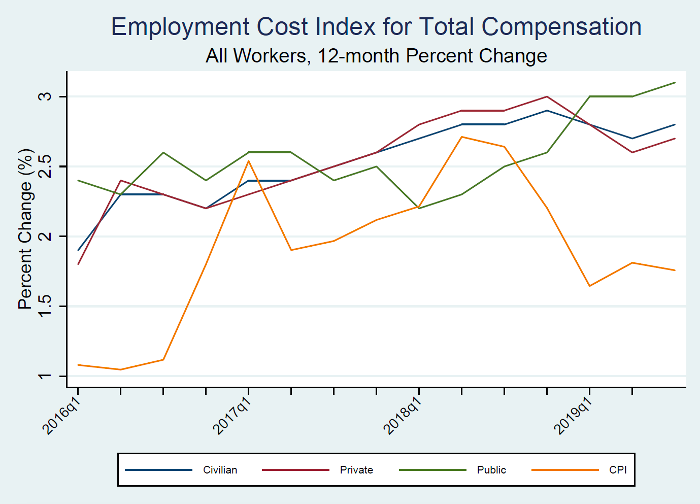
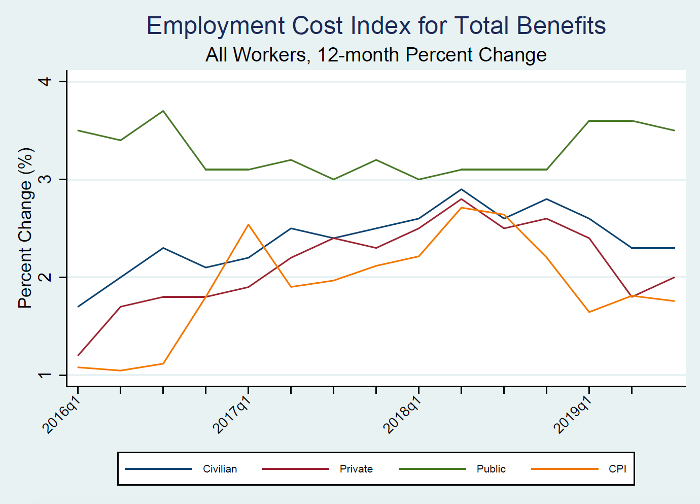
The acceleration in the ECI for all employees is due to the growth for private-sector employees. Chart 2 shows how the trend in ECI for all civilian workers is driven by the trend for private-sector employees. This relationship is due to the size of the public versus the private sectors. Total compensation growth continues for the public sector, which has not seen a slow down since Q1 – 2018. Chart 3 shows that a comparable pattern of accelerating growth for public-sector employees in total benefits softened this quarter, falling from 3.6 percent to 3.5 percent.
Chart 2
Data source: BLS (ECI Historical Listing, October 31, 2019)
Chart 3
Data source: BLS (ECI Historical Listing, October 31, 2019)
Narrowing of total compensation growth variation across the country
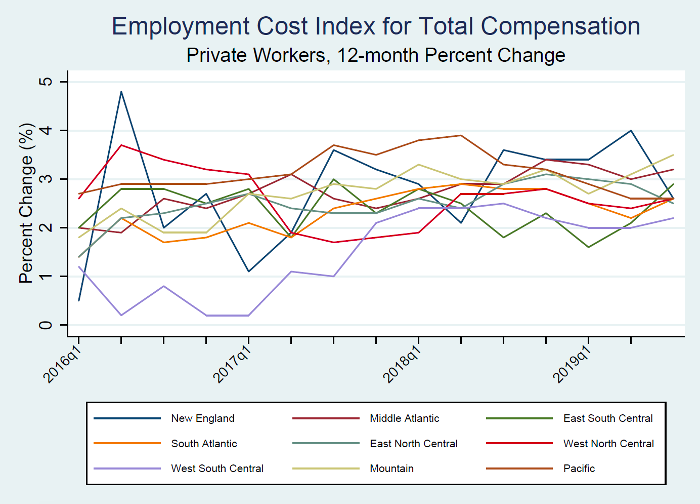
The variation in ECI across U.S. Census divisions contracted this quarter to its second lowest level since Q1 – 2016 (Chart 4). The spread of ECI estimates across the country currently is a difference of 1.3 percentage points (West South Central compared to Mountain) relative to the 2.0 point gap last quarter (West Central South compared to New England). Notably, New England experienced a large slowing of its ECI, dropping from 4.0 percent last quarter to 2.6 percent. The East South Central division saw the fastest growth over the last quarter’s ECI, moving from 2.1 percent to 2.9 percent.
Chart 4
Data source: BLS (ECI Historical Listing, October 31, 2019)
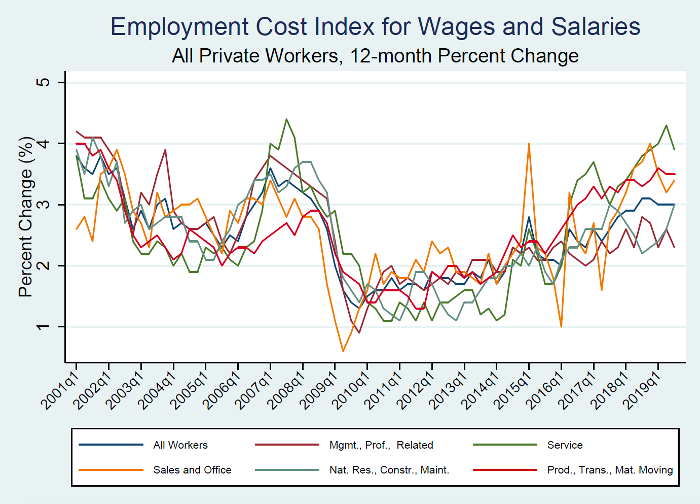
Among private-sector employees, only those in sales and office or natural resource, construction, and maintenance occupations saw increasing growth in earnings
Focusing in on the growth in wages and salaries for private-sector employees reveals that the only occupations experiencing accelerating growth are the groupings of sales and office and of natural resources, construction, and maintenance (Chart 5). The latter grouping extended its trend of expanding growth to four consecutive quarters, moving from 2.2 percent in Q3 – 2018 to 3.0 percent today. The long seven-quarter period of accelerating growth for those in service jobs ended this quarter, falling from 4.3 percent last quarter to 3.9 percent.
Chart 5
Data source: BLS (ECI Historical Listing, October 31, 2019)
The Employment Cost Index (ECI) released October 31st 2019 by the U.S. Bureau of Labor Statistics reflects trends in the costs to employers for the total compensation, wages, and benefits they provide to their workers. The ECI is one of the labor market indicators used by the Federal Reserve Board to monitor the effects of fiscal and monetary policies and is released quarterly. The BLS summary can be found at https://www.bls.gov/news.release/eci.nr0.htm.


