


2019 Second Quarter
2019 Second Quarter: With unemployment rate steady, year-on-year compensation growth softens
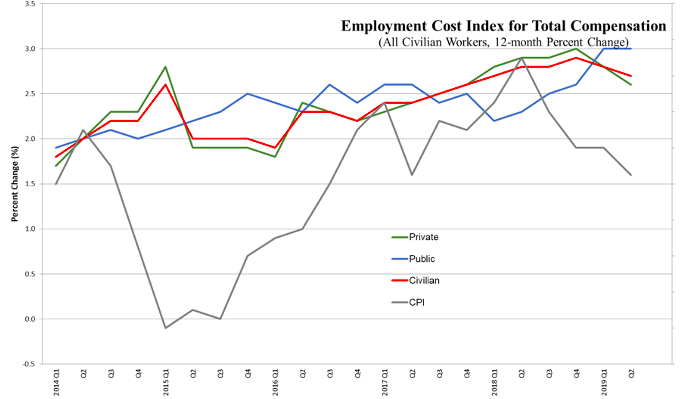
Chart 1

Prepared by Cornell Institute for Compensation StudiesTM
Data source: BLS (ECI Historical Listing, July 31, 2019)
Tuesday, August 6, 2019
Civilian workers cost to employers holds at 2.7 percent growth per year.
Released July 31st 2019, the U.S. Bureau of Labor Statistics’ 12-month Employment Cost Index (ECI) decreased slightly in the second quarter of 2019, slipping to 2.7 percent. This marks the second consecutive quarter with declining inflation. Before Q1 – 2019, the ECI for all civilian workers had steadily increased since Q4 – 2016, rising to 2.9 percent in Q4 – 2018, which is the highest during the last ten years after the end of Great Recession in Q3 – 2009. The 12-month ECI of 2.8 percent in Q1 – 2019 was equal to the lowest point between the end of the 2001 recession and the start of the Great Recession in Q4 – 2007. The 12-month ECI for private-sector employees declined by 0.2 percentage points from the previous quarter (2.8 percent → 2.6 percent); whereas, it remained at 3.0 percent for the public-sector employees during the same period.
The 12-month ECI of 2.7 percent in this quarter is 1.1 percentage points higher than the 12-month general price inflation experienced by urban consumers of 1.6 percent.[1]
On average, total benefits account for approximately 30 percent of the employer costs for employee total compensation, with wages and salaries comprising the remaining 70 percent. The dip in the 12-month ECI growth for total compensation in Q2 – 2019 is driven by the slowing growth in total benefit costs other than health benefit costs. Inflation of total benefit costs fell by 0.3 percentage points between Q1 and Q2 of 2019. In contrast, the 12-month ECI for health benefit costs rose by 0.4 percentage points from the previous quarter (Table 1). The 12-month ECI for health benefit costs had reported a record low of 1.1 percent in Q3 and Q4 of 2017 but reversed its course starting from Q1 – 2018. Regarding the employer-provided health benefits by the types of work arrangements, the percentage of health benefits coverage for part-time workers and low-wage workers dropped significantly during 2018. Employer-provided coverage for part-time workers and low-wage workers was 38 percent and 34 percent in 2017, which declined to 21 percent and 24 percent in 2018, respectively.[2]
Table 1
|
Employment Cost Index for All Civilian Workers, 12-month Percent Change |
||||
|
Period |
Total Compensation |
Wages and Salaries |
Benefits |
|
|
Total Benefits |
Health Benefits |
|||
|
2016 Q1 |
1.9 |
2.0 |
1.7 |
3.3 |
|
2016 Q2 |
2.3 |
2.5 |
2.0 |
2.8 |
|
2016 Q3 |
2.3 |
2.4 |
2.3 |
2.7 |
|
2016 Q4 |
2.2 |
2.3 |
2.1 |
2.7 |
|
2017 Q1 |
2.4 |
2.5 |
2.2 |
1.3 |
|
2017 Q2 |
2.4 |
2.3 |
2.5 |
1.2 |
|
2017 Q3 |
2.5 |
2.5 |
2.4 |
1.1 |
|
2017 Q4 |
2.6 |
2.5 |
2.5 |
1.1 |
|
2018 Q1 |
2.7 |
2.7 |
2.6 |
1.5 |
|
2018 Q2 |
2.8 |
2.8 |
2.9 |
1.6 |
|
2018 Q3 |
2.8 |
2.9 |
2.6 |
1.9 |
|
2018 Q4 |
2.9 |
3.1 |
2.8 |
1.8 |
|
2019 Q1 |
2.8 |
2.9 |
2.6 |
1.9 |
|
2019 Q2 |
2.7 |
2.9 |
2.3 |
2.3 |
Prepared by Cornell Institute for Compensation StudiesTM
Data source: BLS (ECI Historical Listing, July 31, 2019)
Among private sector employees, the weakening total compensation growth continues except for those in service-related and management, business, and finance occupations
Turning the focus to private-sector employees by occupation and industry, the sales-related occupations continue to have highly volatile 12-month ECI for total compensation. Since recording the highest inflation (4.2 percent) among all occupational groups in Q4 – 2018, the sales-related occupations have experienced the sharpest deceleration of growth among all groups, slowing by 0.8 percentage points in Q1 – 2019 and then by 0.4 percentage points in the current quarter.
Chart 2

Data source: BLS (ECI Historical Listing, July 31, 2019)
Another notable trend is the relative lack of growth for professional employees’ total compensation. While professionals were once one of the groups with the highest ECI rates prior to the Great Recession, they have typically had the lowest total compensation ECI since 2015 (Chart 2).
Similarly, the financial industry has been historically one of the industries with the highest 12-month ECI for wages and salaries. Looking at the last two years of data, all industries with the exception of financial experienced an accelerating, albeit with a fair amount of volatility, growth trend. Between Q2 – 2017 and Q2 – 2019, the financial industry’s year-on-year total compensation growth has slowed by 0.9 percentage points with a steep dip and peak in between (Chart 3).
Chart 3

Data source: BLS (ECI Historical Listing, July 31, 2019)
The strong total compensation growth continues for public-sector employees, driven by high growth in benefit costs
The fourth quarter acceleration of growth in total compensation for public-sector employees plateaued this quarter. The 12-month ECI growth for public-sector employees remained at 3.0 percent, which is still the highest since the end of recession in Q3 – 2009 (Chart 4). The strong total compensation growth for public-sector employees is driven by the increase in total benefit costs. While the growth in costs of total benefits for private industries has remained relatively low, slipping by 0.6 percentage points from the previous quarter to 1.8 percent, the public-sector reported 3.6 percent growth in total benefits (Chart 5).
Chart 4
Data source: BLS (ECI Historical Listing, July 31, 2019)
Chart 5

Data source: BLS (ECI Historical Listing, July 31, 2019)
The Employment Cost Index (ECI) released July 31st 2019 by the U.S. Bureau of Labor Statistics reflects trends in the costs to employers for the total compensation, wages, and benefits they provide to their workers. The ECI is one of the labor market indicators used by the Federal Reserve Board to monitor the effects of fiscal and monetary policies and is released quarterly. The BLS summary can be found at https://www.bls.gov/news.release/eci.nr0.htm.


