

2013 Third Quarter
• Total compensation ECI continuing its post-recession 2 percent trend for all workers.
• Despite its higher unemployment rate, the West is experiencing more rapidly rising wage and salary costs.
Civilian workers costing employers 2.0 percent more than a year ago.
The cost of U.S. employees’ wages, salaries and benefits rose by 2.0 percent over the previous 12 months, according to the latest Employment Cost Index released January 31st by the U.S. Bureau of Labor Statistics (Chart 1).
Chart 1

Institute for Compensation Studies™
Data Source: BLS (ECI Historical Listing, February 4, 2014)
This small increase in the ECI is noteworthy in that it is the first acceleration in the compensation inflation measure since September 2012. That said, the 12-month total compensation ECI has not been consistently above two percent since the end of 2008. In contrast, note that for the five and a half years between the end of the 2001 recession and the start of the Great Recession, the 12-month ECI never dropped below 2.8 percent (Q1, 2006) and registered 3.5 percent or higher for 13 of 23 quarters.
The general price inflation experienced by urban consumers (December 2013, revised) is 1.5 percent (annual CPI-U)1
BLS, CPI-U, U.S. City Average, All Items, 12-month change from December 2012 to December 2013, NSA, http://www.bls.gov/cpi/
.
On average, employer-provided benefits compose roughly 30 percent of the total compensation costs of employees, with wages and salaries composing the remaining 70 percent. This quarter’s 0.1 percentage point increase in the 12-month ECI for total compensation is driven entirely by increasing growth in wages and salaries, which reached a nineteen-quarter high of 1.9 percent (Table 1).
Table 1
|
Employment Cost Index 12-month, not seasonally adjusted All Civilian Workers (Percent change over preceding 12 months) |
|||
|---|---|---|---|
|
Total Compensation |
Wages and Salaries |
Benefits |
|
|
2009 Q1 |
2.1 |
2.2 |
2.0 |
|
2009 Q2 |
1.8 |
1.8 |
1.8 |
|
2009 Q3 |
1.5 |
1.5 |
1.5 |
|
2009 Q4 |
1.4 |
1.5 |
1.5 |
|
2010 Q1 |
1.7 |
1.5 |
2.2 |
|
2010 Q2 |
1.9 |
1.6 |
2.5 |
|
2010 Q3 |
1.9 |
1.5 |
2.8 |
|
2010 Q4 |
2.0 |
1.6 |
2.9 |
|
2011 Q1 |
2.0 |
1.6 |
3.0 |
|
2011 Q2 |
2.2 |
1.6 |
3.6 |
|
2011 Q3 |
2.0 |
1.6 |
3.2 |
|
2011 Q4 |
2.0 |
1.4 |
3.2 |
|
2012 Q1 |
1.9 |
1.7 |
2.7 |
|
2012 Q2 |
1.7 |
1.7 |
2.1 |
|
2012 Q3 |
1.9 |
1.7 |
2.4 |
|
2012 Q4 |
1.9 |
1.7 |
2.4 |
|
2013 Q1 |
1.9 |
1.6 |
2.4 |
|
2013 Q2 |
1.9 |
1.7 |
2.2 |
|
2013 Q3 |
1.9 |
1.6 |
2.2 |
|
2013 Q4 |
2.0 |
1.9 |
2.2 |
Institute for Compensation Studies™
Data Source: BLS (ECI Historical Listing, February 4, 2014)
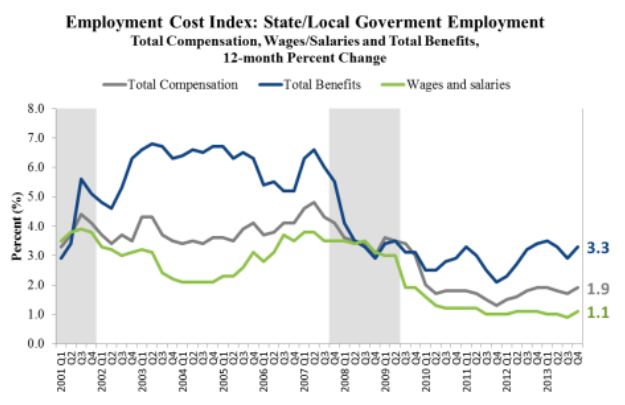
In government sector, benefit costs continue to rise more than 3.0 percent annually
Total compensation costs for employers in the public sector (state and local government) have risen 1.9 percent above where they were 12 months ago, maintaining a steady (albeit gentle) upward two-year trend. The annual inflation rate of wages and salaries of government employees increased slightly to 1.1 percent, up from 0.9 percent last quarter. The growth in benefits rebounded to 3.3 percent, not sufficient, however, to surpass the post-recession highpoint of 3.5 percent reached in the first quarter of 2013. Prior to the Great Recession, the annual inflation rate of benefits for government employees averaged 6.1 percent and never dipped below 4.6 percent from Q1 2002 through Q3 2007. (Chart 2).
Chart 2
Institute for Compensation Studies™
Data Source: BLS (ECI Historical Listing, February 4, 2014)
For private sector employers, slower growth in benefits costs
For private sector employees, the difference between the 12-month ECI for total compensation and that for wages and salaries remains fairly negligible. The inflation rate for wages and salaries rose to 2.1 percent, the first quarter since the Great Recession that reported an annual inflation rate of wages and salaries above 2.0 percent. The increase in the private sector 12-month ECI for wages and salaries was somewhat offset by a slight slowing in the rise of employers costs for employee benefits (from 2.0 to 1.9 percent). (Chart 3). On net, employer costs of total compensation for private sector employees pushed back up to a growth rate of 2.0 percent.
Chart 3

Institute for Compensation Studies™
Data Source: BLS (ECI Historical Listing, February 4, 2014)
Large Changes in Regional Employer Cost Index for Wages/Salaries in West
Since the fourth quarter of 2012, the accelerating rate of wage and salary cost increases for private sector employers in the West2 stands out, surpassing all other regions. (Chart 4). The West’s annual inflation rate for wages and salaries of 2.4 percent is the highest that it’s been since the fourth quarter of 2008. This, despite the West’s comparatively worse unemployment trend and current rate of 7.4 percent in December 2013 (Chart 5).
Chart 4

Data Source: BLS (ECI Historical Listing, February 4, 2014)
Chart 5

Data Source: BLS (Local Area Unemployment Statistics, February 4, 2014)
About the Employment Cost Index (ECI) Series
The Office of Compensation Levels and Trends of the U.S. Bureau of Labor Statistics (BLS) produces the Employment Cost Index (ECI) Series. It is designated as a Principal Federal Economic Indicator by the Office of Management and Budget. It is the only measure of labor costs that treats wages and salaries and total compensation consistently and that provides consistent subseries by occupation and industry. The ECI is used by the Federal Reserve Board to monitor the effects of fiscal and monetary policies and to formulate those policies. It enables analysts and policymakers to assess the effects of labor cost changes on the economy, both in the aggregate and by sectors. The ECI is particularly important in studies of the relationships among prices, productivity, labor costs, and employment. The ECI also is used to determine increases in Medicare payments to hospitals and doctors and as a labor cost escalator in long-term contracts.
Data for the December 2013 reference period were collected from a probability sample of approximately 44,200 occupational observations selected from a sample of about 9,100 establishments in private industry and approximately 9,100 occupations from a sample of about 1,400 establishments in state and local governments.


