

2013 Second Quarter
-
Total compensation ECI remains at 1.9%.
-
Employment Cost Index aligns with July’s BLS Employment Situation report, both signal steady recovery in the U.S. labor market, with emphasis on lower-paying jobs.
-
Leisure and hospitality continue softening trend in wage and salary ECI.
Civilian workers costing employers 1.9 percent more than a year ago
The cost of U.S. employees’ wages, salaries and benefits rose by 1.9 percent over the previous 12 months, according to the latest Employment Cost Index (ECI) released July 31st by the U.S. Bureau of Labor Statistics (Chart 1).1
Seasonally adjusted, compensation costs increased 0.5 percent for the 3-month period ending June 2013. This is the same 3-month increase as reported in March 2013.
Seasonally adjusted, compensation costs increased 0.5 percent for the 3-month period ending June 2013. This is the same 3-month increase as reported in March 2013.
This is the fourth quarter in a row where the 12-month ECI held at 1.9 percent. In fact, since the start of 2009, the annual rate of inflation for total compensation has remained between 1.4 percent and 2.2 percent. For the five and a half years between the end of the 2001 recession and the start of the Great Recession, the 12-month ECI never dropped below 2.8 percent (Q1, 2006) and registered 3.5 percent or higher 13 of 23 quarters.
Chart 1

The lowered total compensation ECI indicates a longer-term softened labor market (as employers look to minimize costs by employing more part-time workers and replacing human labor with technological innovations), and an overall lower inflation rate. General price inflation is currently 1.8 percent (annual CPI-U).2
BLS News Release “Consumer Price Index – June 2013.” http://www.bls.gov/news.release/pdf/cpi.pdf.
On average, employer-provided benefits compose roughly 30 percent of the total compensation costs of employees, with wages and salaries composing the remaining 70 percent. This quarter’s continued flat-lining of the 12-month total compensation ECI was the result of a slightly increasing inflation rate for wages and salaries being offset by a decreasing inflation rate for benefits.
Table 1
|
Employment Cost Index 12-month, not seasonally adjusted All Civilian Workers (Percent change over preceding 12 months) |
|||
|---|---|---|---|
|
|
Total Compensation |
Wages and Salaries | Benefits |
|
2012 Q3 |
1.9 |
1.7 | 2.4 |
|
2012 Q4 |
1.9 |
1.7 | 2.4 |
| 2013 Q1 | 1.9 | 1.6 | 2.4 |
| 2013 Q2 | 1.9 | 1.7 | 2.2 |
Patterns in employer costs differ for private, government sectors
While monthly net changes in private sector employment have been positive since 2010, hiring in state and local governments have yet to turn consistently positive (Chart 2).
Chart 2

Despite the relatively stronger private sector hiring picture, private sector employers saw total costs for employee compensation rise only slightly faster over the previous 12 months than did state and local governments, 1.9 versus 1.8 percent, respectively. The dramatic difference is in the longer patterns of growth in wage and salary costs versus benefit costs in the two sectors (Charts 3 and 4).
Chart 3

Chart 4
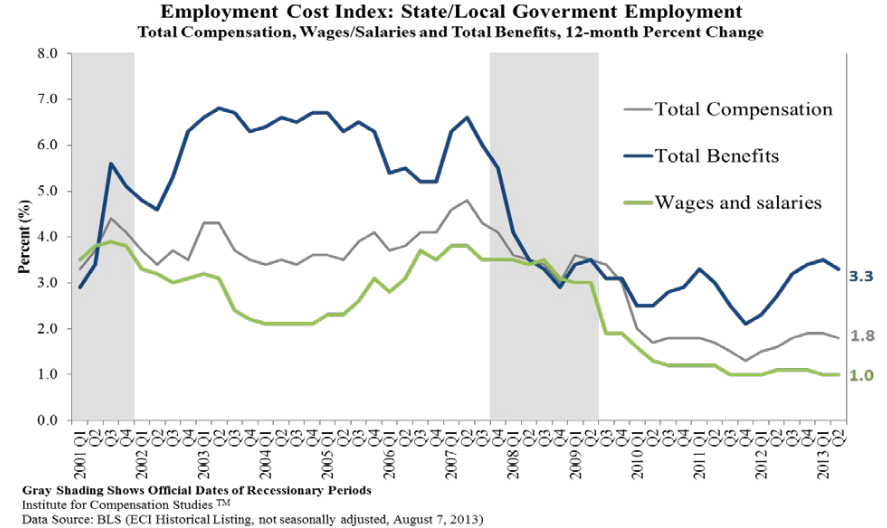
From the start of the recession in Q4 2007 until the present, there were only four quarters (Q2 2011 – Q1 2012) when the 12-month ECI for employee benefits was greater in the private sector than in the public sector. Since Q2 2010, however, the private sector12-month ECI for wages and salaries has consistently outstripped that for state and local governments.
Annual inflation of wages and salaries continues to be lowest in the leisure and hospitality
The employer cost index for wages and salaries remains below 1 percent in the Leisure and Hospitality sector (Chart 5). According to the latest ECI report, employers’ costs for wages and salaries are just 0.7 of a percent higher than 12 months ago. This annual growth rate is half that of the next lowest industry, Education and Health Services, where wages and salaries 1.5 percent higher than in July 2012. In Leisure and Hospitality, wages and salaries make up around 80% of total compensation, higher than the economy-wide average, making the noticeably lower wage and salary ECI is particularly noteworthy.
Chart 5

Institute for Compensation Studies™
Data Sources: BLS (ECI Historical Listing, not seasonally adjusted, August 7, 2013)
While not as far above the pack as Leisure and Hospitality is below, the Financial Activities sector does stand out for its upward trend in wage and salary growth rates since 2012 and recording its second quarter of annual wage and salary growth exceeding that in other industries.


