
U.S. EMPLOYMENT COST INDEX, Q3 2026 COMMENTARY
2026 Third Quarter Summary – ECI acceleration holds below inflation
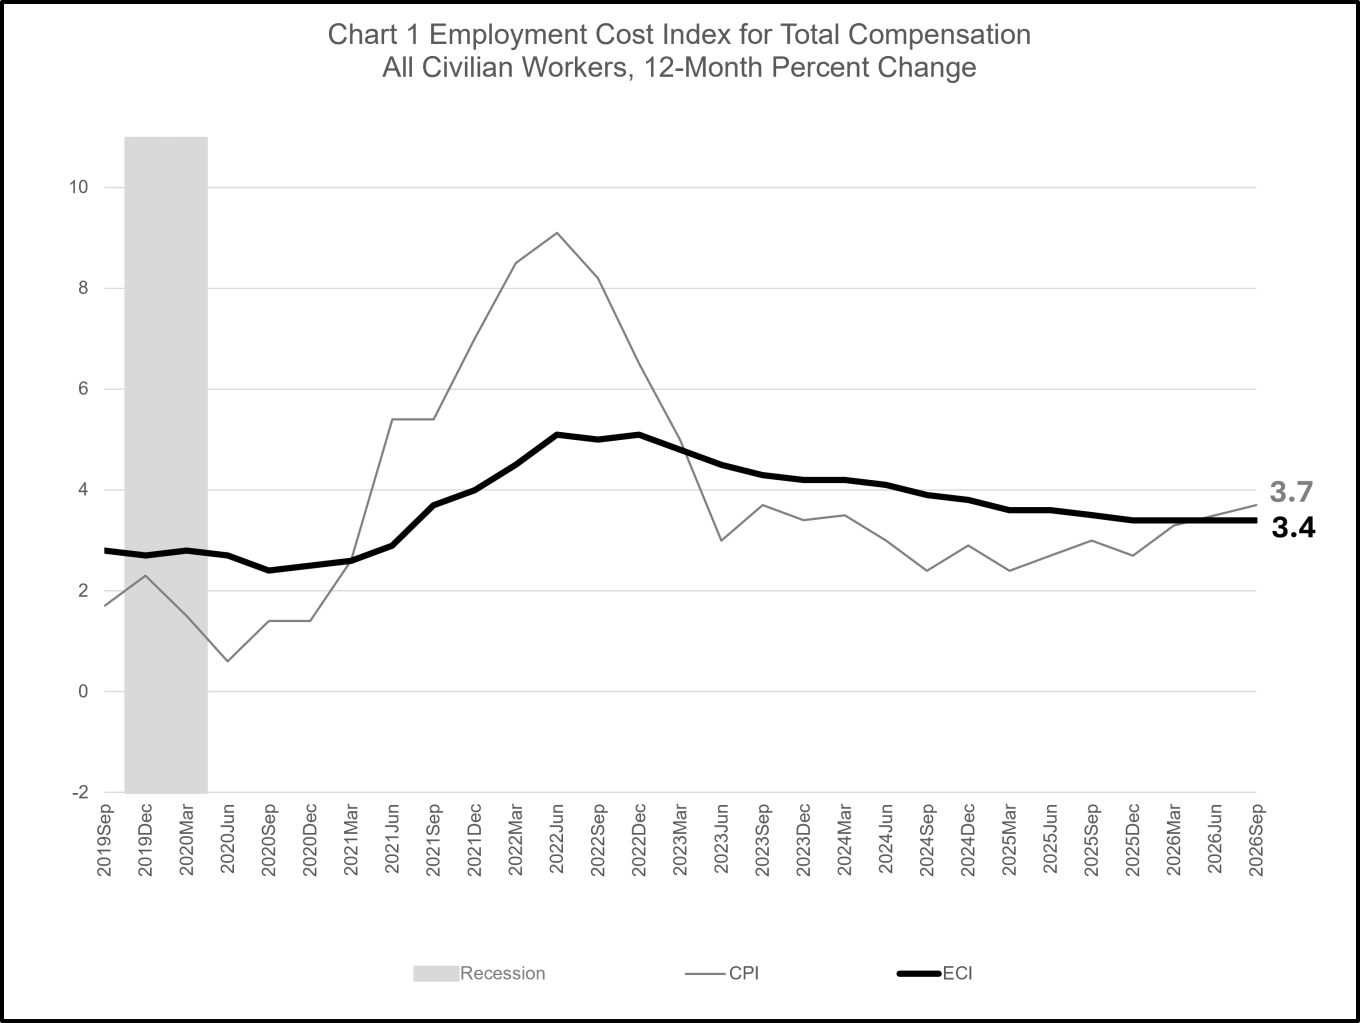
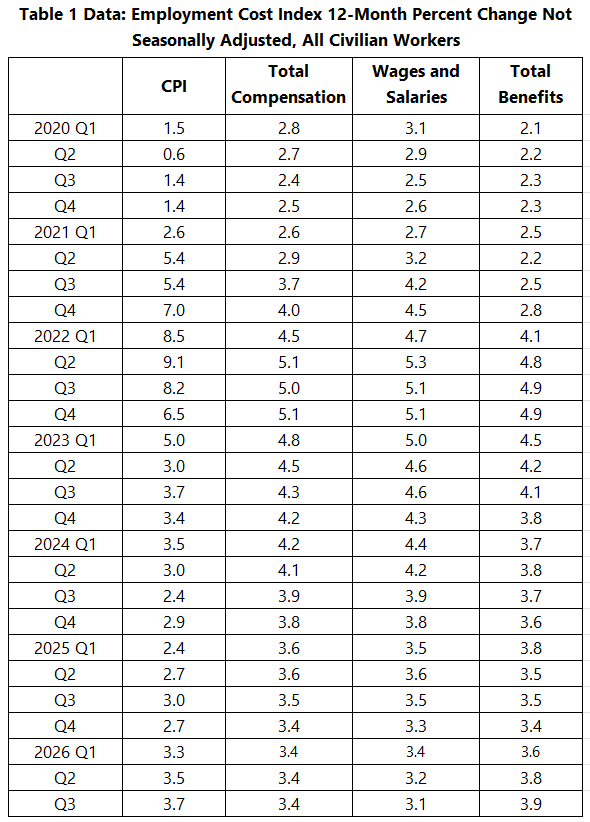
While overall U.S. inflation continues to accelerate, the growth in employers’ overall costs of employee compensation is holding flat. The 12-month Employment Cost Index (ECI), released by the U.S. Bureau of Labor Statistics (BLS) on October 30, 2026, registered at 3.4 percent for the fourth quarter in a row, while the Consumer Price Index for All Urban Consumers (CPI-U) rose to 3.7 percent (Chart 1, Table 1). The steady 12-month ECI was again the result of the lower ECI for wages and salaries, offsetting an accelerating growth rate of employer costs for employee benefits.
Chart 1
Data Source: U.S. Bureau of Labor Statistics, Employment Cost Index, September 2026, released October 30, 2026.
See Chart 1 Data for Employment Cost Index for Total Compensation for All Civilian Workers, 12-Month Percent Change.
Data Source: U.S. Bureau of Labor Statistics, Employment Cost Index, September 2026, released October 30, 2026.
See Table 1 Data for Employment Cost Index 12-Month Percent Change—Not Seasonally Adjusted, All Civilian Workers.
Divergence in the ECI for wages and salaries versus the ECI for total benefits
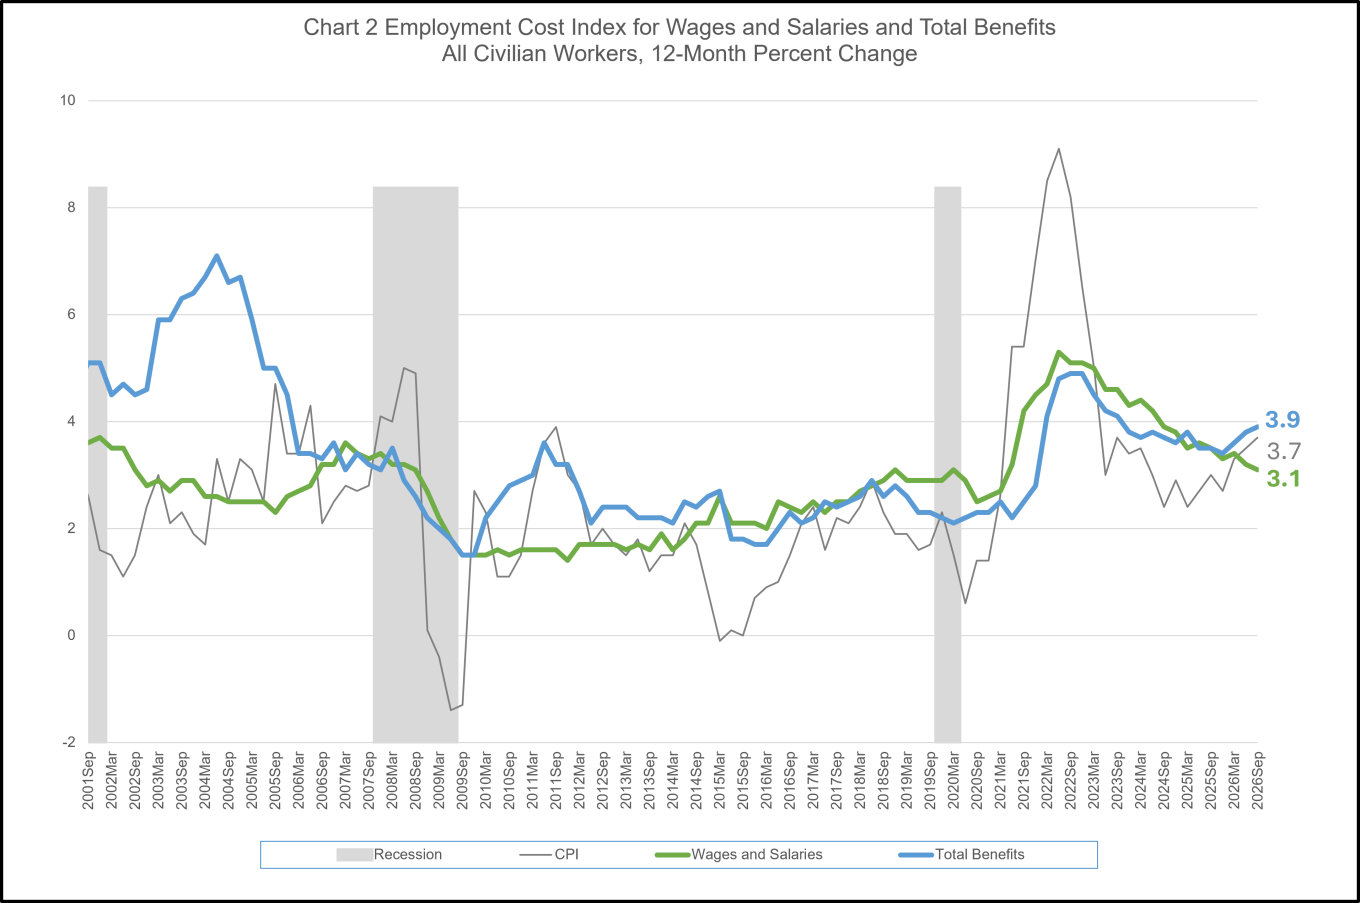
The Q3 year-on-year ECI for employee benefits of 3.9 percent continues an upward climb from last year’s low of 3.4 percent. The growth rate of wages and salaries, in contrast, continues its four-year downward trend. Employer costs for all civilian worker wages and salaries grew just 3.1 percent, 0.6 percentage points below overall inflation (Chart 2).
Chart 2
Data Source: U.S. Bureau of Labor Statistics, Employment Cost Index, September 2026, released October 30, 2026.
See Chart 2 Data for Employment Cost Index for Wages and Salaries and Total Benefits—All Civilian Workers, 12-Month Percent Change.
Unionized workers compensation costs rising faster than nonunion pay and benefits
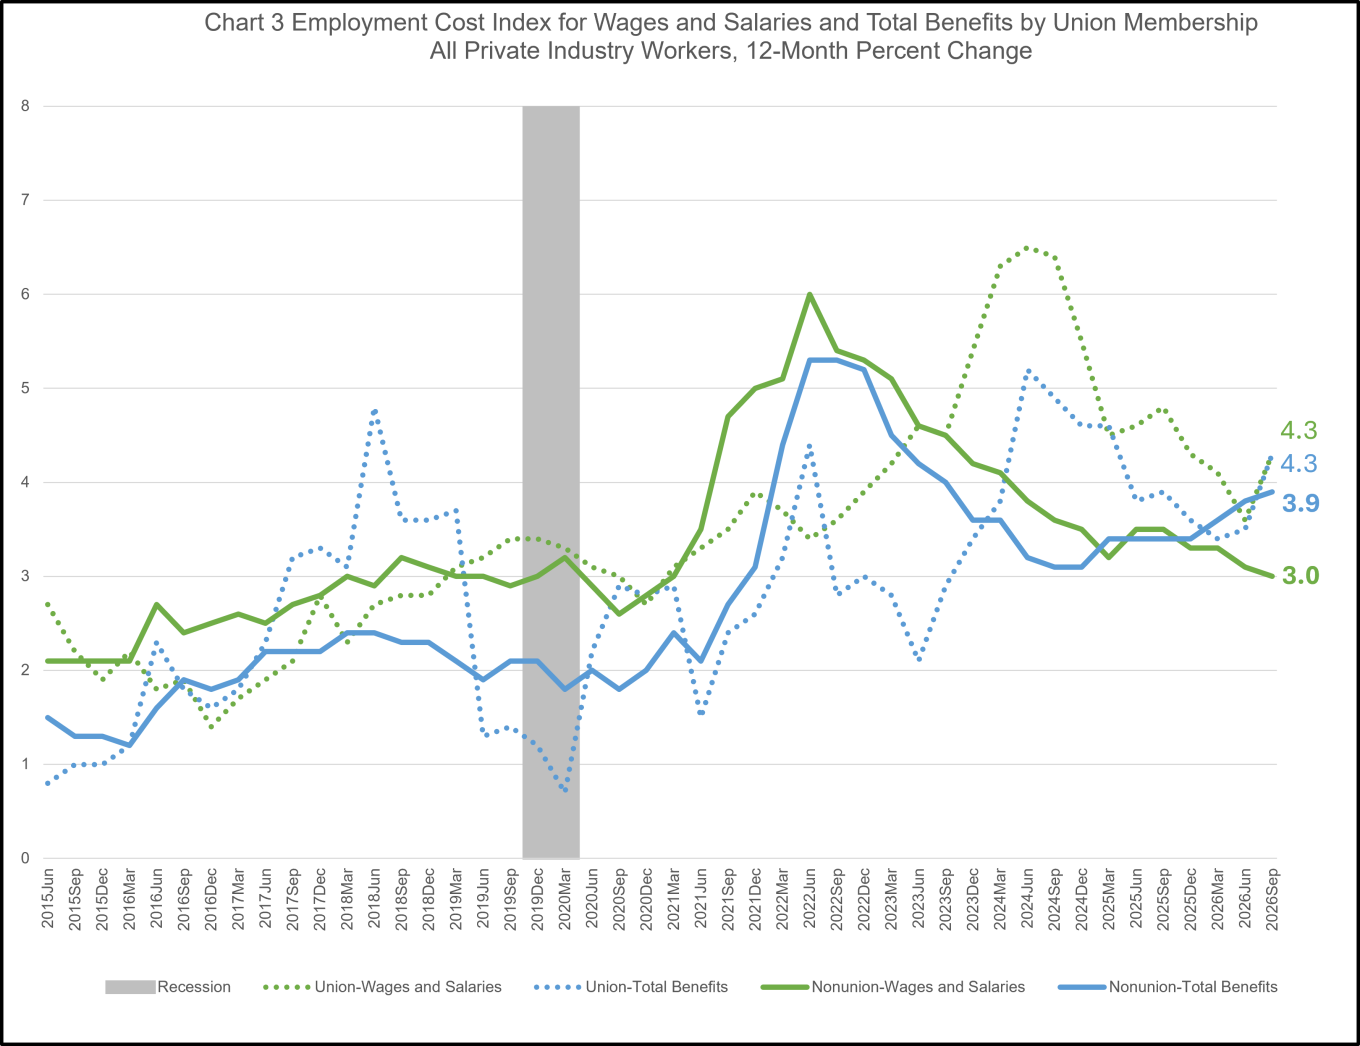
Compensation growth premiums for unionized workers over nonunionized workers widened in the third quarter of 2026. Union wage and salary growth rose sharply over the last 12 months, to 4.3 percent from 3.6 percent, as the CPI rose to 3.7 percent from 3.5 percent (Chart 3). Meanwhile, nonunion wage and salary growth eased slightly to 3.0 percent from 3.1 percent, increasing the union-nonunion wage growth gap to 1.3 percentage points, from 0.5 percentage point in the second quarter. On the benefits side, the pattern was more muted. Union total benefits growth accelerated sharply to 4.3 percent, up from 3.5 percent in Q2, as nonunion total benefits growth accelerated only slightly from 3.8 to 3.9 percent. Overall, the third quarter reflects a faster growth for employer costs of both wages and benefits for union workers than for their nonunion counterparts.
Chart 3
Data Source: U.S. Bureau of Labor Statistics, Employment Cost Index, September 2026, released October 30, 2026.
See Chart 3 Data for Employment Cost Index for Wages and Salaries and Total Benefits by Union Membership—All Private Industry Workers, 12-Month Percent Change.
Q3 affirms acceleration trend in employer costs for healthcare benefits
After Q1’s dip in the growth rate of employer-provided health insurance costs for private industry workers, this quarter’s year-on-year cost increases accelerated beyond Q2’s rebound. For the twelve months ending in September, private sector health insurance costs to employers rose 6.4 percent, two and half (2.5) percentage points above the ECI for overall benefits (Chart 4). This raises concern that the modest decline in Q1 2026 was an exception to rising acceleration trend, beginning in Q4 2023. It has been some 20 years since employers faced employee healthcare costs rising consistently above 6 percent, year-on-year.
Chart 4
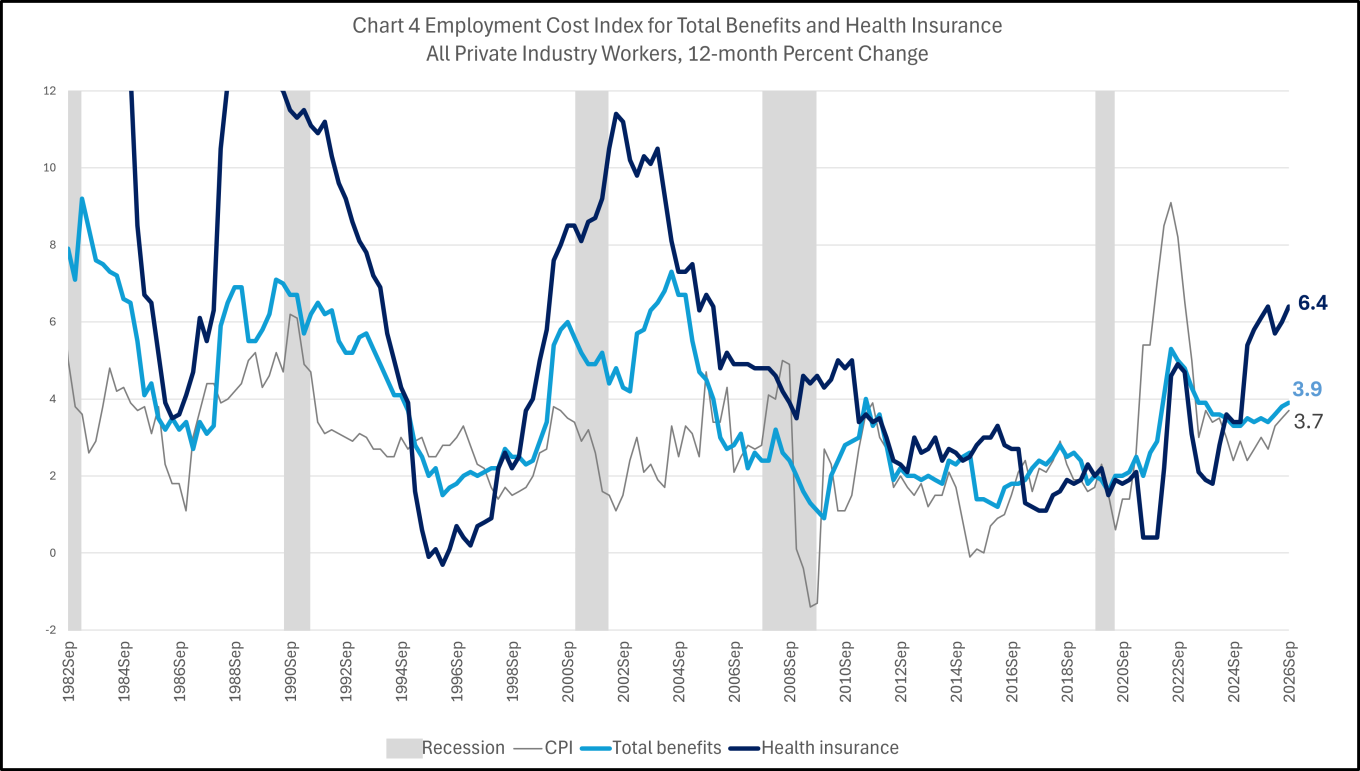
Data Source: U.S. Bureau of Labor Statistics, Employment Cost Index, September 2026, released October 30, 2026.
See Chart 4 Data for Employment Cost Index for Total Benefits and Health Insurance—All Private Industries Workers, 12-Month Percent Change.
ECI’s rearview mirror on employers’ benefits costs aligns with current actions
ECI is a record of employers’ cost experiences over the past three months. It is, therefore, a look in the rearview mirror, but nonetheless a view that reveals no indication of slowing ahead. Recent private sector (non-governmental) surveys that query employers current and future expectations and actions, such as the Mercer/Marsh National Survey of Employer-Sponsored Health Plan, reinforce that employers are challenged by accelerating employee healthcare costs. While employer expectations for rising employee healthcare costs aren’t captured in the ECI, these expectations, compounded by cost actuals are driving employers to consider changes to employee healthcare benefits.
This fall, as employers finalize employee benefits for the coming year, many household-name companies are offering reduced employee healthcare benefits, such as scaling back spousal coverage, ending coverage of GLP-1 weight loss drugs, or raising monthly premium contributions and co-pays.
While financial pressures are inducing many employers to increase their employees’ share of rising healthcare benefit costs, those that can retain better health benefits may differentiate themselves with regard to recruitment and retention.
Other input prices are rising even faster than compensation costs
The last 12 months have seen employers squeezed by many rising costs. The Producer Price Index (PPI), also computed by the U.S. Bureau of Labor Statistics, measures changes in non-employee related costs, separating intermediate from final product demand. Where the ECI measures the inflationary pressures from labor (employer costs of employee compensation), the intermediate demand PPI measures price changes for goods, services, and non-capital maintenance/repair products sold to businesses as inputs for further processing, and is subdivided for various types of goods. Important subindexes of the intermediate demand PPI have risen many times faster than the ECI (Chart 5).
Chart 5
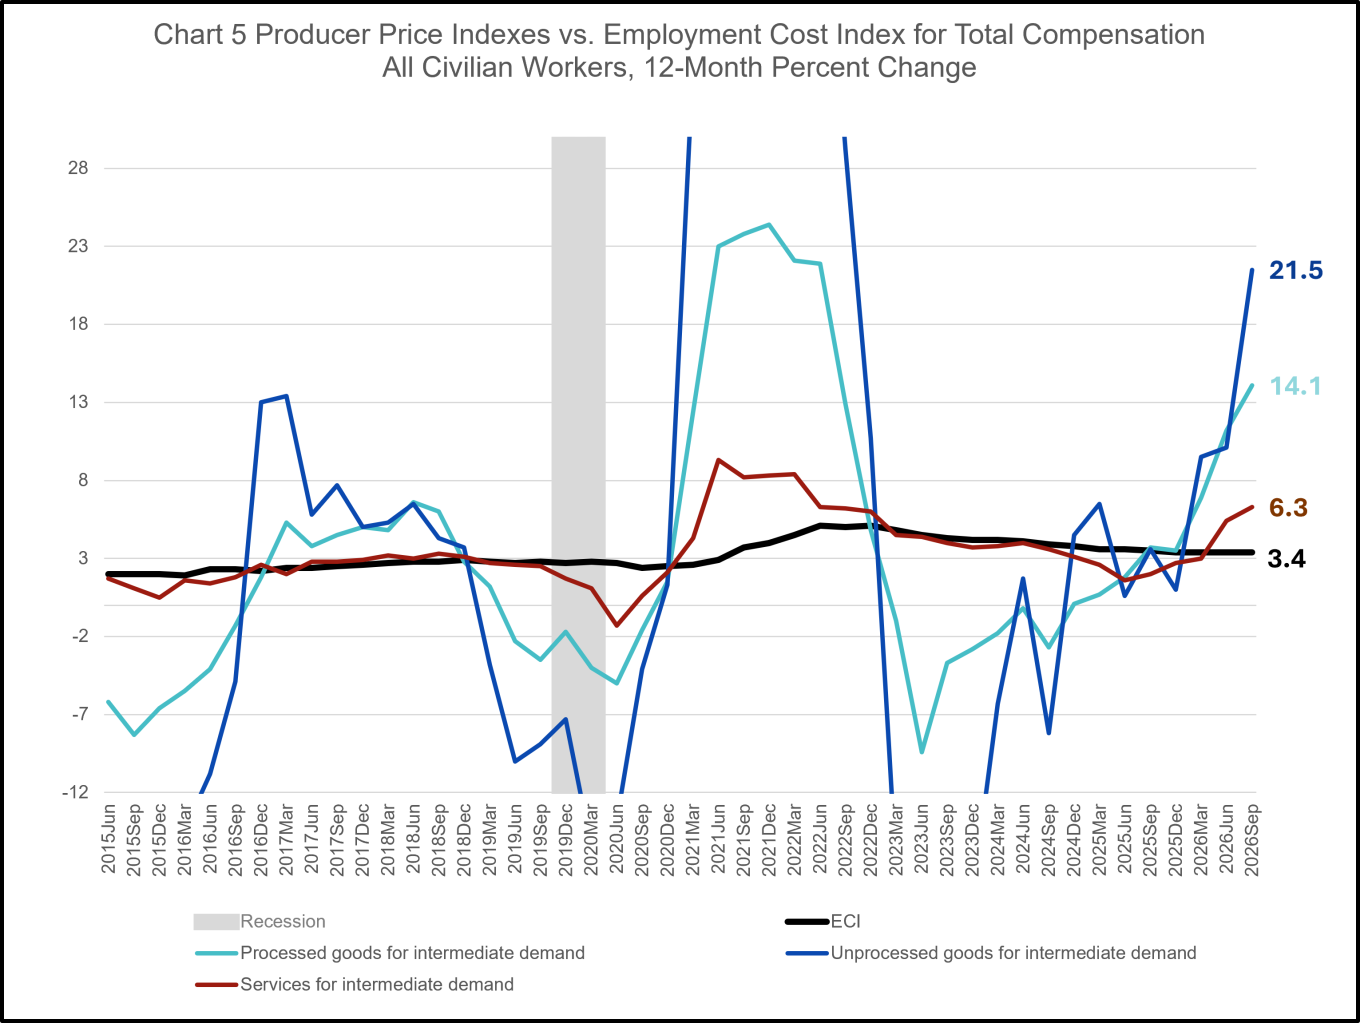
Data Source: U.S. Bureau of Labor Statistics, Employment Cost Index, September 2026, released October 30, 2026 and Producer Price Index, September 2026, released October 15, 2026.
The largest price increases have been for Unprocessed Goods, such as petroleum and raw materials, which increased by 21.5 percent over the last 12 months, more than six times faster than ECI. Prices for Processed Inputs, such as electronic components and other parts, have risen by 14.1 percent, more than 4 times faster than ECI. Even prices for Services have risen at almost double the pace of compensation costs. Pressed by a plethora of rising prices, many companies are faced with choosing between reducing profit margins, passing cost increases onto customers, or constraining the few costs under their control, such as wages and benefits.
See Chart 5 Data for Producer Price Indexes vs. Employment Cost Index—All Civilian Workers, 12-Month Percent Change.
Data Notes: The Employment Cost Index (ECI) is produced by the U.S. Bureau of Labor Statistics to measure trends in the costs of compensation paid by employers to their employees, free from the influence of employment shifts among occupations and industries. The ECI is one of the labor market indicators used by the Federal Reserve Board to monitor the effects of fiscal and monetary policies and is released quarterly with a one-month lag.
Data for the Q3 2026 reference period (the 3-months ending in September 2026) were collected from a probability sample of approximately 28,000 occupational observations selected from a sample of about 6,600 private industry establishments and approximately 7,300 occupational observations selected from a sample of about 1,400 state and local government establishments that provided data at the initial interview.
Link to most recent ECI release: https://www.bls.gov/news.release/pdf/eci.pdf.
The Institute for Compensation Studies (ICS) at Cornell University’s ILR School is an interdisciplinary center that researches, teaches, and communicates about monetary and non-monetary rewards from work, and how these rewards influence outcomes for individuals, companies, industries, and economies. At the crossroads between scholarship and practice, ICS is an exchange dedicated to helping new knowledge hit its mark in the world of work.
Contact:
Erica L. Groshen
Senior Economics Advisor
Institute for Compensation Studies
Authors:
Linda Barrington, Cornell SC Johnson College of Business
Star Yanxin Gao, Cornell University – ILR School
Erica L. Groshen, Cornell University – ILR School
The Institute for Compensation Studies