

2010 Fourth Quarter
ECI consistent with an economy accelerating away from the recession’s labor market trough, but “very, very slowly.”
For the 12 months ending December 2010, employer spending on wages, salaries, and benefits across the civilian U.S. labor force rose an even two percent (2.0 percent), according to the Employment Cost Index released Friday January 28, 2011 by the U.S. Bureau of Labor Statistics. 1
Seasonally adjusted, compensation costs increased 0.4 percent for the 3-month period ending December 2010, which is flat with the previous quarter’s 3-month increase.

This is the fourth quarter in a row where total compensation for civilian U.S. workers (which includes private and public sectors) held flat or increased over the previous 12 months, and is the highest 12-month percent change since March 2009. 2
In March 2009, the CPI-U was actually negative, -0.4 percent over the previous 12 months, attributable to falling energy prices. This was the first 12 month decline in the CPI-U since August 1955.See U.S. Bureau Labor Statistics, Consumer Price Index, Consumer Price Index Detailed Report (complete text and tables), March 2009 (PDF cpi0903[1].pdf) downloaded 1/28/11 from http://www.bls.gov/cpi/#tables, editors Malik Crawford and Sanjeev Katz.
This pattern is consistent with an economy pulling out of labor market trough, but accelerating very, very slowly. Annual inflation (CPI-U) currently stands at 1.5 percent.3
During the past 12 months, the Consumer Price Index for All Urban Consumers index increased 1.5 percent before seasonal adjustment. See Consumer Price Index Summary, http://www.bls.gov/news.release/cpi.nr0.htm.
Wage and salary costs vs. benefits
If one is looking to find solid optimism in this quarter’s Employment Cost Index, digging deeper into the underpinning components may only get you a glass 1/3 full. It is a case of acceleration in employers’ spending on benefits that continues to trump increases in wages and salaries. What employers across the private sector and within state and local governments spent on employee benefits is up 2.9 percent over the 12 months ending December 2010. This is slightly higher again than the 2.8 percent more for the 12 months ending September 2010. Benefit costs to employers appear to be back on the acceleration path.
It is important to remember that the benefit costs paid by employers make up approximately 30 percent of total cost of employment compensation for private sector employers and 35 percent for state and local governments. Wages and salaries make up the remaining 70 percent for private sector employees and 65 percent for employees in state and local governments.4
The next ECEC release is scheduled for 10:00 a.m. (EST), Wednesday, March 9, 2011.
|
Relative importance of employer costs for employee compensation (ECEC) as of September 2010 |
|||
|
Compensation component |
Civilian workers |
Private industry |
State and local government |
|
Wages and salaries |
69.5% |
70.6% |
65.5% |
|
Benefits |
30.5 |
29.4 |
34.5 |
It is compensation in the form of wages and salaries that employees most directly recognize as what their employers are paying them in reward for their work efforts. Employees, however, have not experienced the same spending acceleration in their take-home wages and salaries, as recorded in benefit costs. The last series of accelerating quarterly year-on-year wage and salary costs ended four years ago.
In the case of state and local governments, it could be that the deceleration in wage and salary growth, evidenced in a multi-year declining Employment Cost Index series for wages and salaries (12-month percent change), may be bottoming out. But nothing yet signals a re- acceleration. It is more likely that the very weak public sector labor market is persisting (for more see last quarter’s commentary, ICS Commentary – US Employment Cost Index, Q3 2010, Nov. 1, 2010, pages 3 - 4).


In the private sector, the story for employees may be just the slightest bit more positive with wage and salary costs up 1.8 percent for the 12-month period ending December 2010. Consistently increasing or holding flat for four consecutive quarters, the 12-month percent change in the Employment Cost Index for wages and salaries of employees in the private sector suggests real but very gentle acceleration, welcome news for employees. Such moderate acceleration should also give no pause to employers considering increased hiring, at least no pause from the wage and salary side of compensation. Acceleration in the 12-month percent change in benefit costs has been steep since its turn up a year ago. Employer costs for health benefits rose 5.0 percent for the 12-month period ending December 2010, up from 4.3 percent a year ago (December 2009).
According to BLS’ ECI release, “increases in retirement costs” were a primary contributor to the 2.9 percent change recorded for the overall civilian labor force. Specific data for these retirement costs, along with dollar values of other specific compensation components, will be published by the Bureau of Labor Statistics in the forthcoming (March 2011) release of the Employer Costs for Employee Compensation (ECEC) series.
Overall though, one can only infer from this quarter’s Employment Cost Index that the warmth
of recovery in business profits, investment, and optimism has not yet heated up the U.S.
economy to the point of notably thawing wages and salaries across the U.S. civilian labor market.
Through the industry lens
Looking across the various industry groupings, some private sector employees are seeing more and faster acceleration in wages and salaries than others.
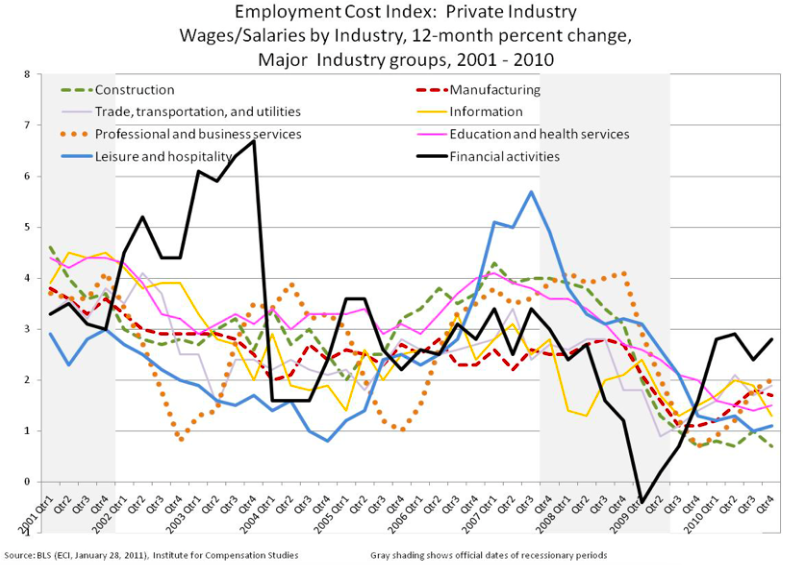
Most notably, financial activities experienced the greatest deceleration in this recession, bottoming out at -0.4 percent change for the 12-month period ending March 2009 – the only industry group to record an overall decline in wage and salary costs. Since the “going in reverse” report of Q1-2009, the wage and salary 12-month Employment Cost Index for the finance industry accelerated sharply and through 2010 sustained growth rates between 2.4 and 2.9 percent.
It is important to note that even within the finance industry, not all employees are experiencing these higher wage and salary cost gains. For those employees in the finance industry who do not also receive incentive pay, the wage and salary 12-month Employment Cost Index continues to be more on par with the lower increases in other industries.

Wages and salaries increased 1.9 percent for the current 12-month period when incentive paid occupations are excluded from the finance industry grouping. The change was 2.8 percent for the period ending December 2010 when all occupations in the finance activities industry grouping are included.
Wage and salary cost increases for those in leisure and hospitality and in construction continue to be at the bottom of the private sector comparison with increases of just 1.1 and 0.7 percent over the year. These business-to-consumer industries are more tightly linked than others to broader U.S. consumer spending and optimism. Measures such as The Conference Board Consumer Confidence Index® do suggest that the buying public has “begun the year in better spirits”5
Franco, Lynn. “The Conference Board Consumer Confidence Index® Increases”. The Conference Board. January 25, 2011. Web. Accessed 1/29/11. http://www.conference-board.org/press/pressdetail.cfm?pressid=4113
and last week’s announcement of accelerating personal consumption expenditures by the Bureau of Economic Analysis adds credence to the optimism.6
Real personal consumption expenditures increased 4.4 percent (preliminary) in the fourth quarter of 2010, compared with an increase of 2.4 percent in the third. Bureau of Economic Analysis, National Income and Product Accounts, Gross Domestic Product, 4th Quarter and Annual 2010 (advance estimate), January 28, 2011, http://www.bea.gov/newsreleases/national/gdp/2011/gdp4q10_adv.htm
But wages and salaries will not accelerate in these industries until these stronger “spirits” and spending reaches levels that prompt employers to start aggressively rehiring.


