

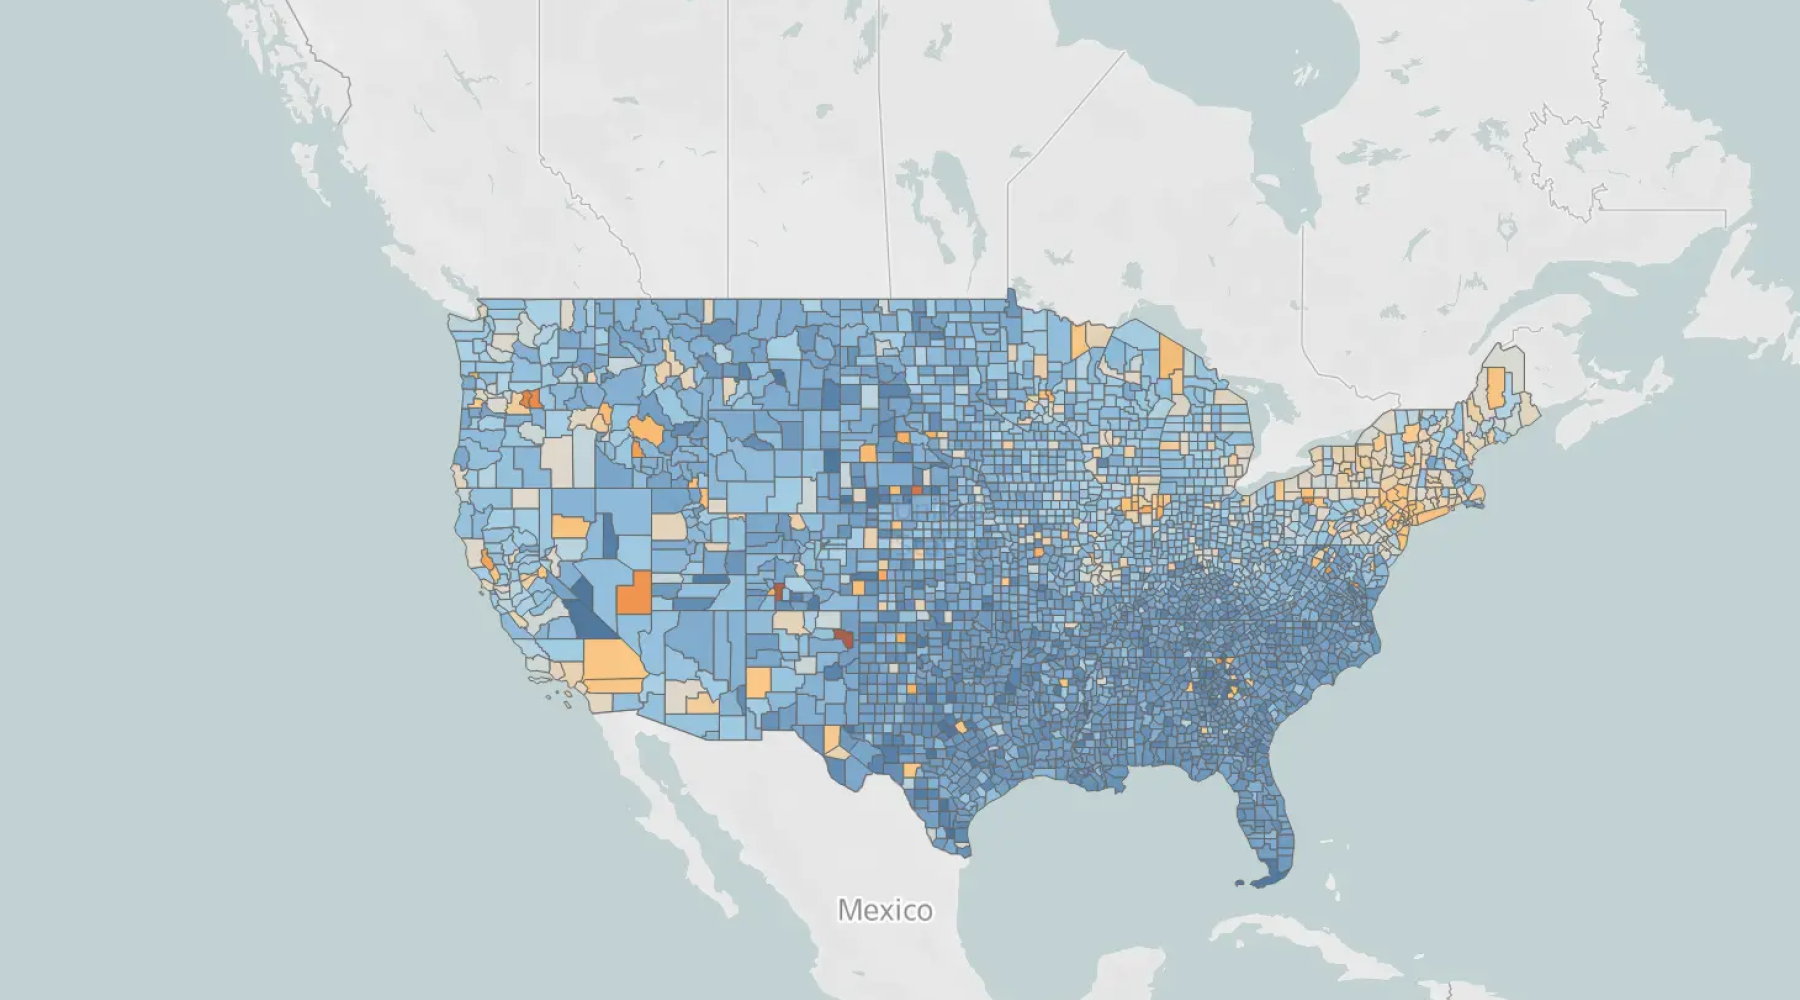
Self-Reported Union Membership in US Declines; NYS Holds About Steady
2026 Update
In honor of Labor Day 2026, and to adhere to our mission of democratizing data, the Cornell ILR Buffalo Co-Lab and Cornell ILR Center for Applied Research on Work (CAROW) have developed a county-level geography of labor union membership for the United States from a non-conventional data source: the MRI-Simmons LOCAL consumer survey.
A close look at this data shows that while union membership went up during the initial stages of the pandemic, any gains that occurred during that time proved to be temporary. We're now seeing falling union densities. New York state, however, remains one of the top-ranked states for (self-reported) union membership and is ahead of national averages.
The MRI-Simmons survey collects and reports data on “the robust geographic nuances” of American “consumer attitudes and lifestyle”. One cluster of questions that features in the survey instrument concerns organizational memberships. Among a host of organizational types, adult survey respondents are asked if they are active labor union members. Upon collecting responses, MRI-Simmons uses sophisticated (proprietary) geobehavioral modeling techniques to produce union membership estimates for various geographies in the United States.
Below, we map these estimates for all U.S. counties in the contiguous United States. Data were obtained via SimplyAnalytics for the years 2013 through 2024. The maps below show what might be thought of as a crude measure of self-reported union density: the number of self-reported labor union members divided by the sum of self-reported employed persons in a county. The reason the measure is not a true proxy for union density is that the denominator is not a measure of a county’s labor force per se; it is simply an estimate of currently employed workers. To minimize the outlying effects that can result from year-to-year sample variation, estimates were pooled into three-year averages, similar to how the U.S. Census Bureau has historically pooled American Community Survey (ACS) estimates into three- and five-year vintages.