


2023 Third Quarter Summary
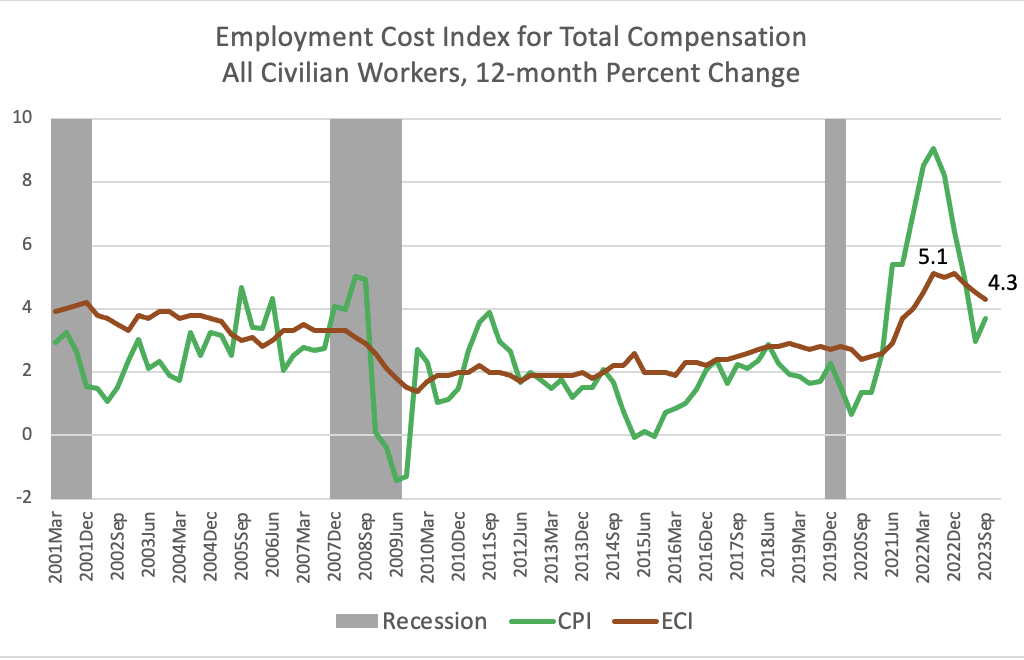
Twelve-month total compensation growth continued the decline that began in Q4 2021, falling from 4.5 percent in the Q2 2023 to 4.3 percent in Q3. In recent quarters there has also been a substantial decrease in the 12-month Consumer Price Index (CPI). As a result, workers’ real compensation rose during Q2 and Q3 2023, recovering some of the losses in workers’ real compensation sustained in 2020-2022.
A 12-month growth rate of 4.3 percent in civilian workers' total compensation costs remains higher than pre-pandemic cost growth.
Released on October 31, 2023, the U.S. Bureau of Labor Statistics’ 12-month Employment Cost Index (ECI) for Q3 2023 declined by 0.2 percentage points from the previous quarter to 4.3 percent (Chart 1). Reflecting rising inflation, from Q2 2021 through Q3 2022 ECI growth rose from 2.9 to 5.1 percent. For twelve years before this run-up (from Q1 2009 to Q1 2021), compensation growth fluctuated within a lower and narrow band (1.4 percent to 2.9 percent).
Chart 1
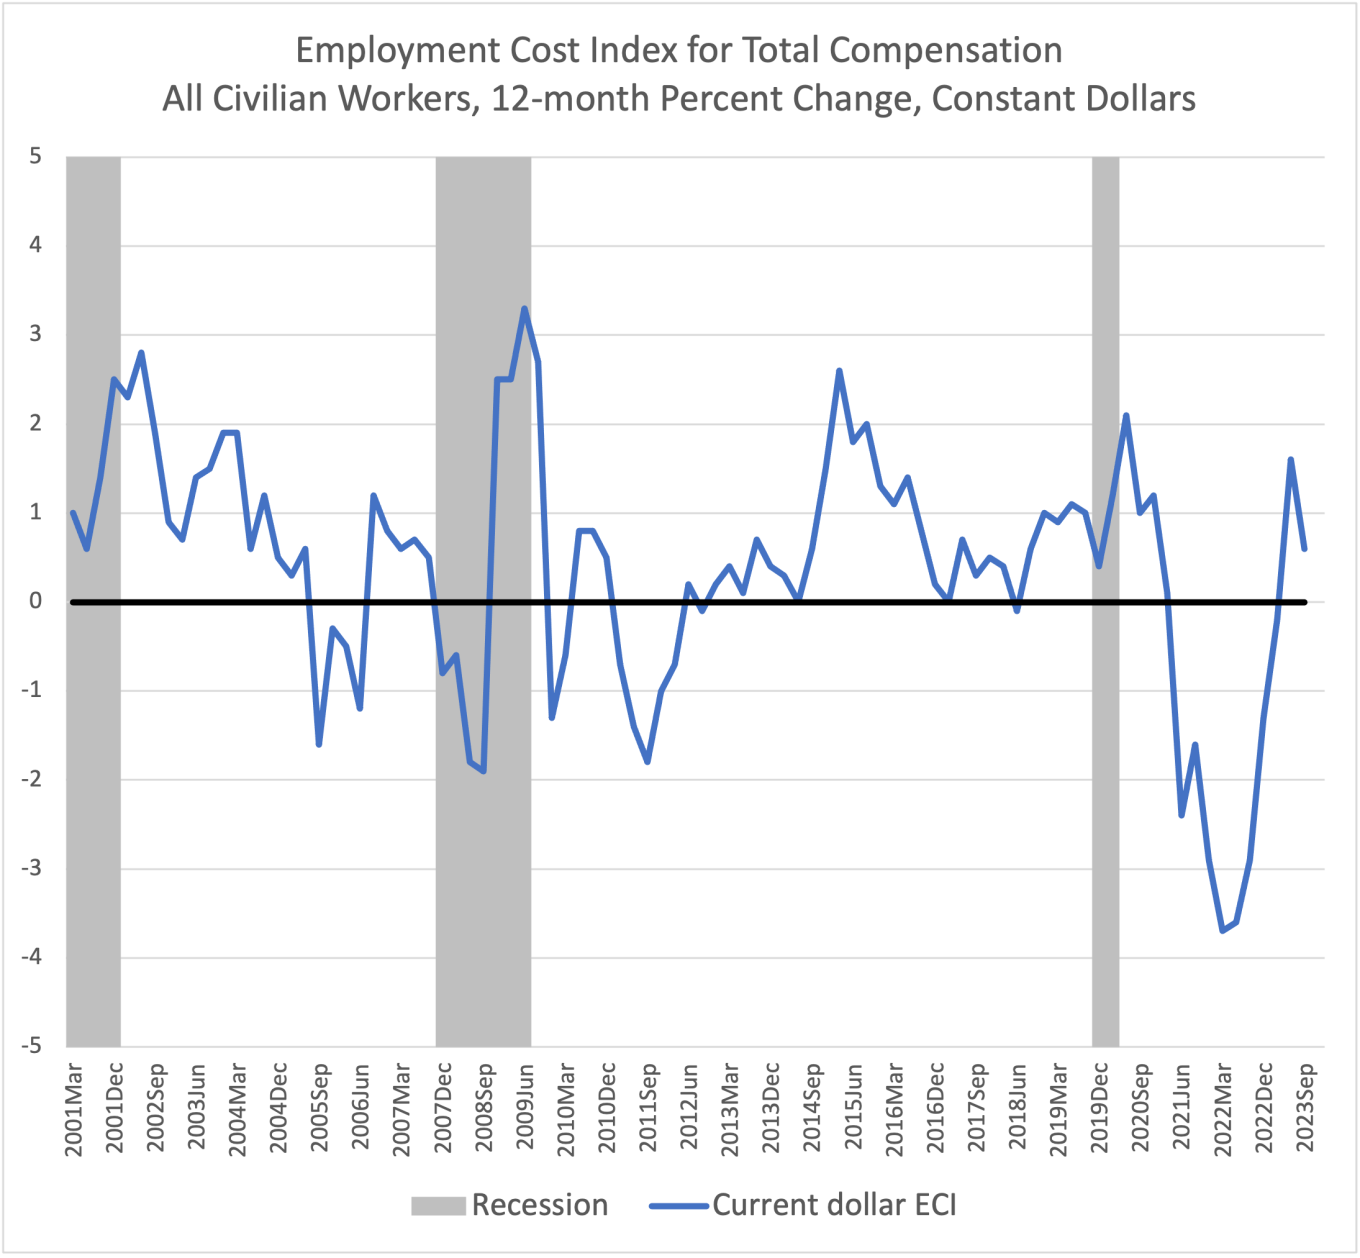
12-month ECI growth in constant dollars slowed in Q3 2023.
Adjusting for inflation, the Q3 2023 12-month total compensation growth rate remains positive, although it has declined from 1.6 percent in Q2 2022 to 0.6 percent (Chart 2). This recent growth recovers some of the inflation-induced decline in real compensation sustained by workers in 2020-2022.
Chart 2
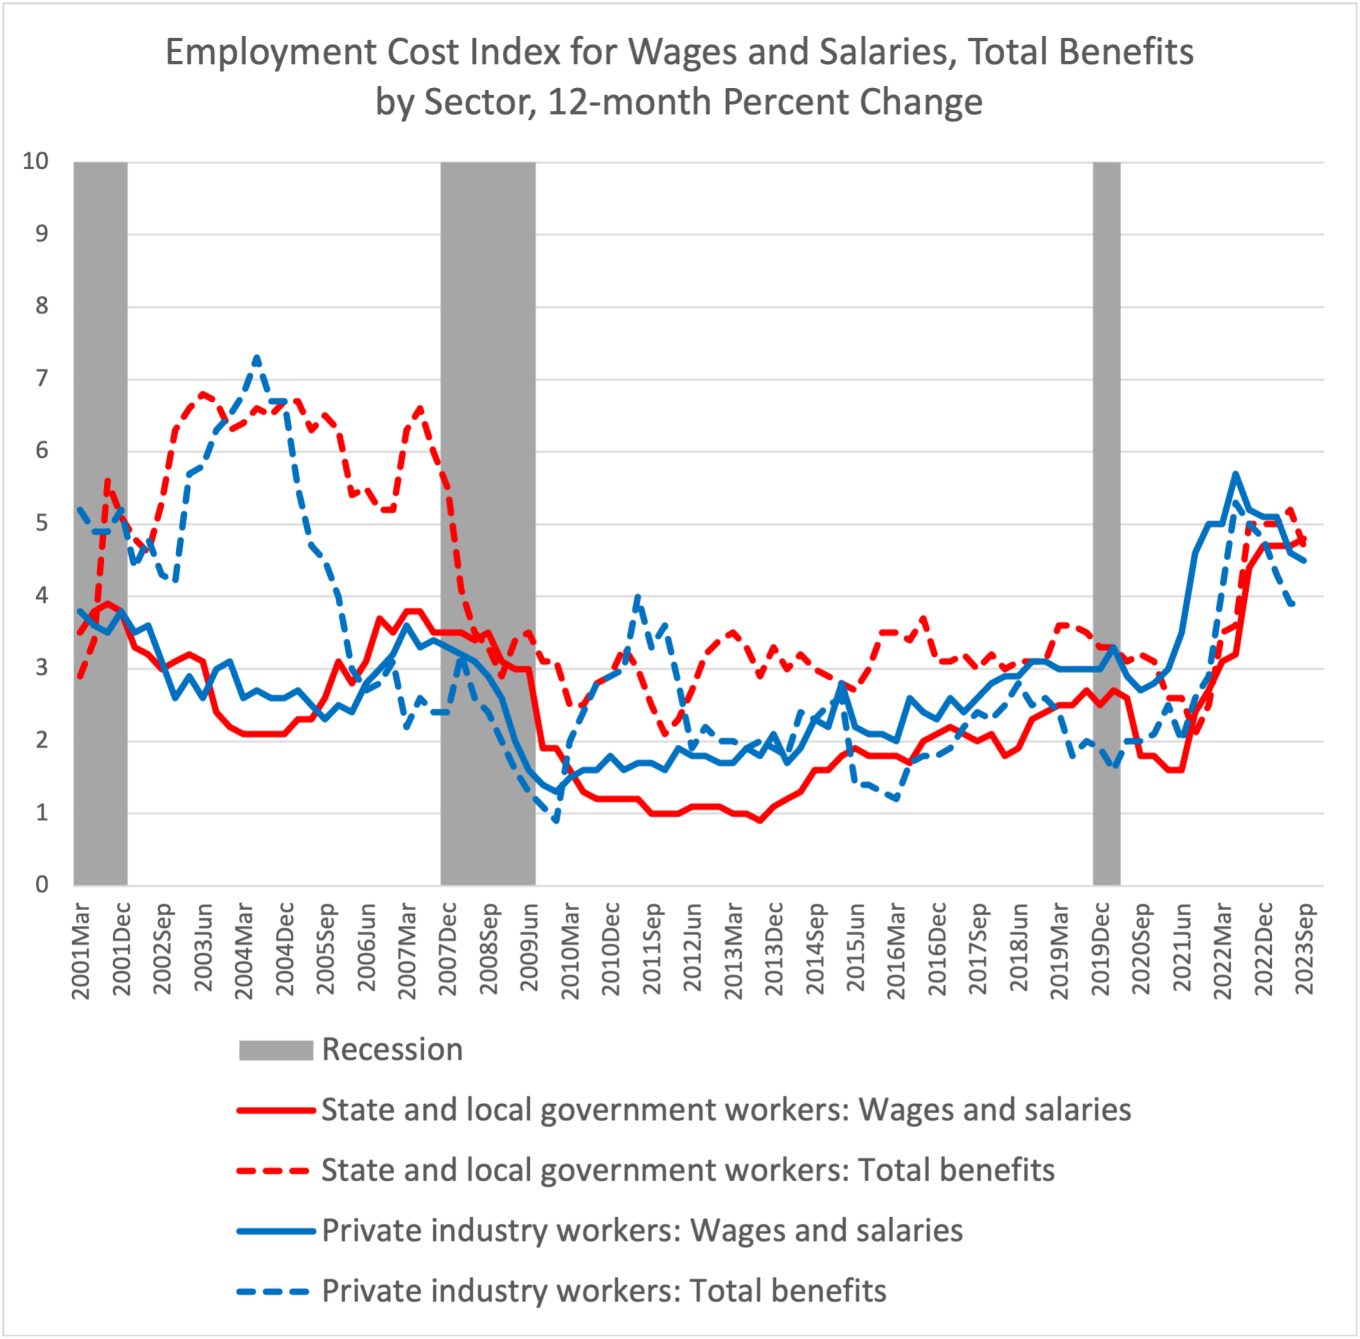
In Q2 and Q3 of 2023, the 12-month growth in government wage and salary and benefits costs ECI growth surpassed those in the private sector.
For the first time since 2010, recent government wage and salary and benefits cost increases have exceeded those in the private sector (Chart 3). Government sector compensation responded more slowly to rising inflation in 2021 and 2022, and now is lagging in response to declining inflation.
Chart 3
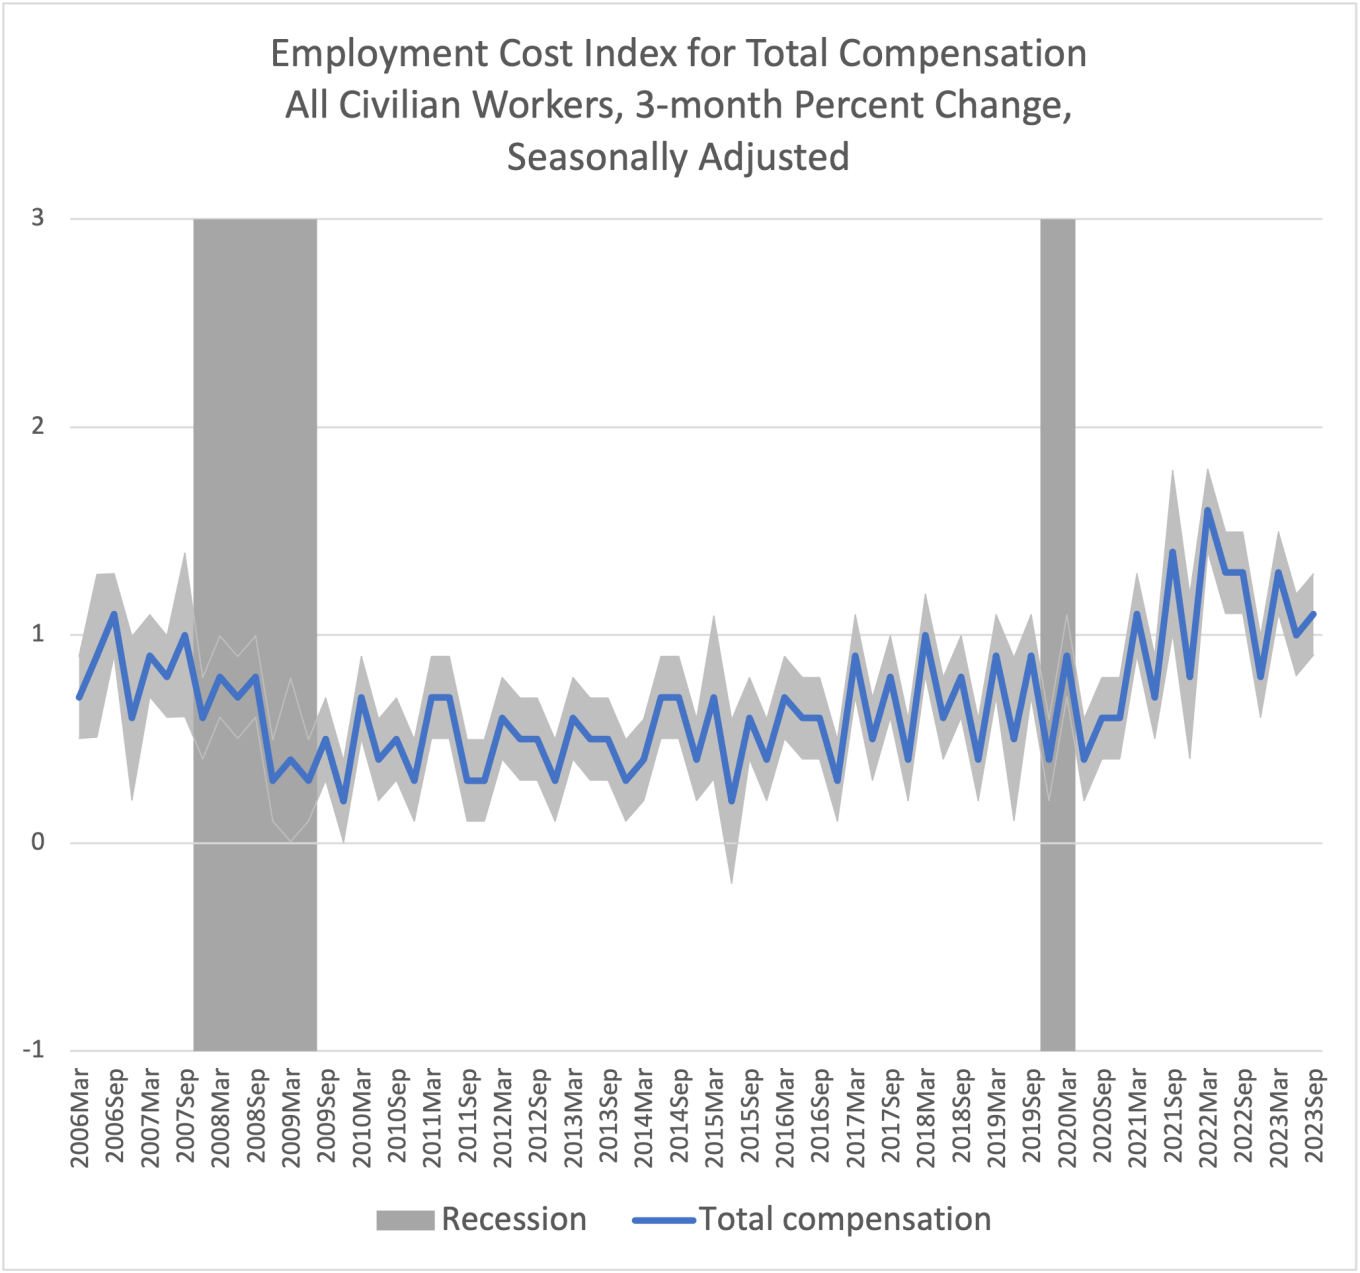
Q3 2023 3-month ECI growth increased slightly compared to the previous quarter.
In contrast to the decline in the 12-month change, the 2023 Q3 3-month total compensation growth rate ticked up from1.0 percent in 2023 Q2 to 1.1 percent in Q3 (Chart 4). However, three-month ECI changes are quite volatile. The standard error the change is 0.1 percentage points, so the rise may simply reflect sampling error.
Chart 4
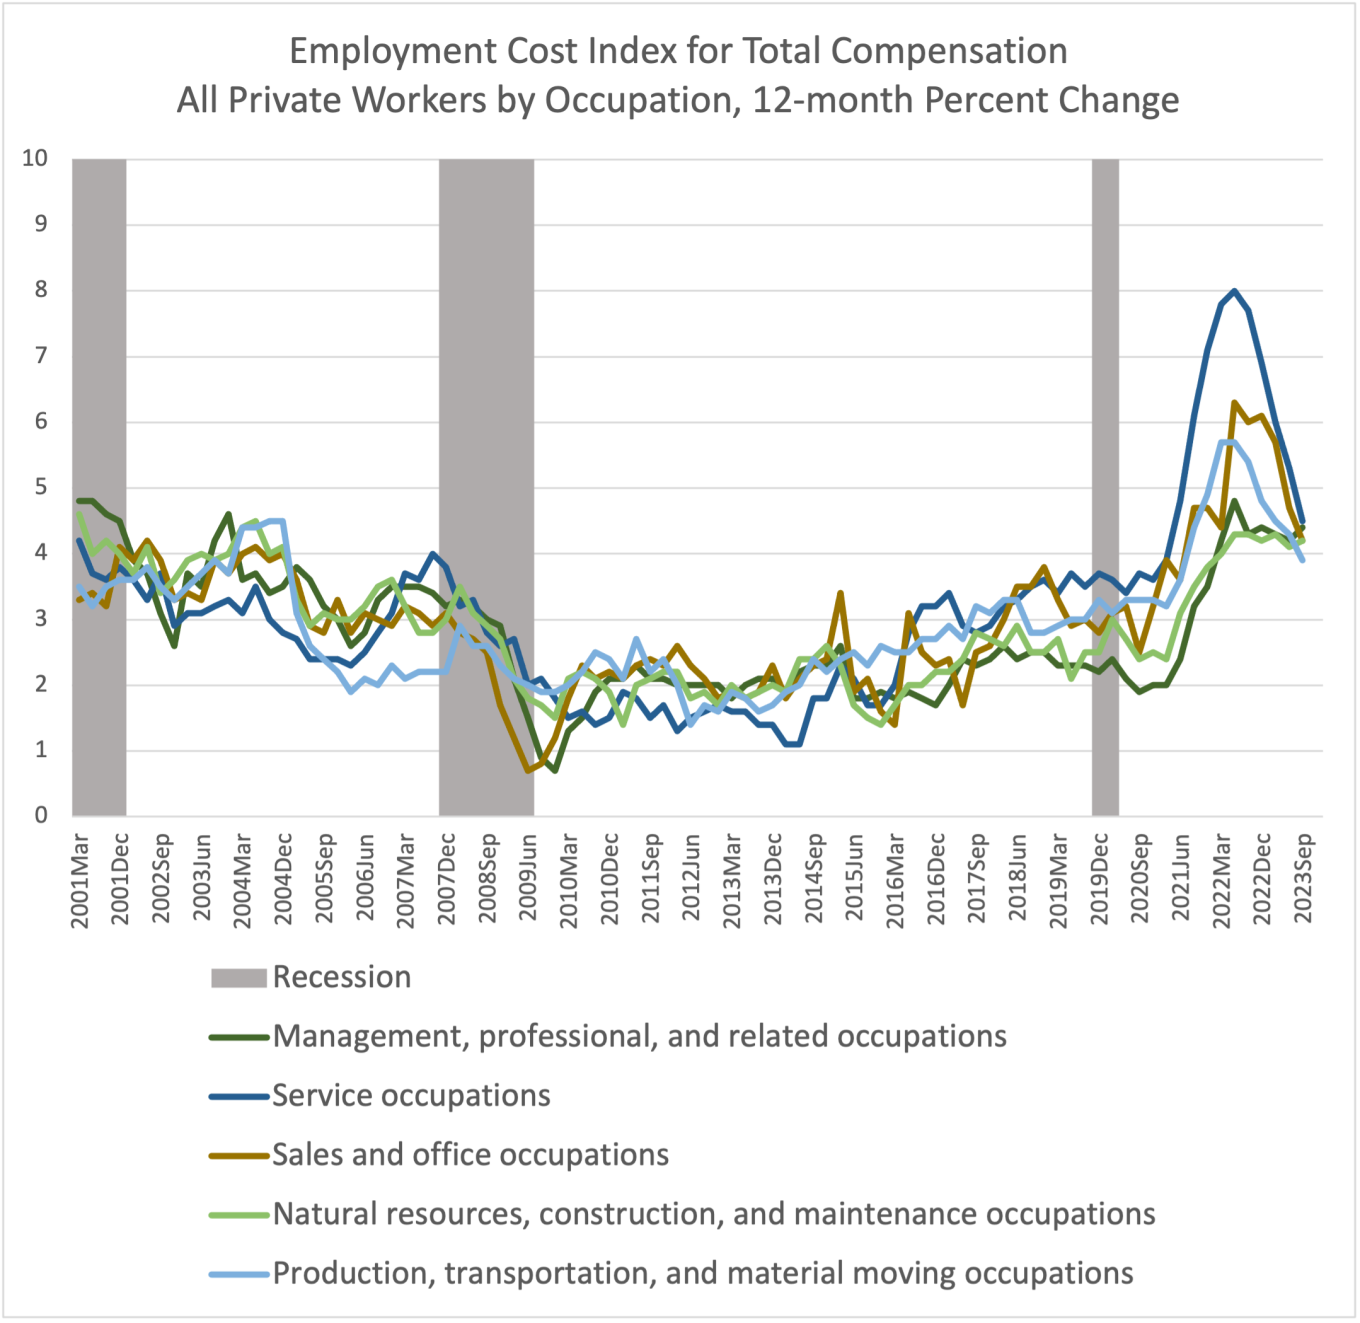
Q3 2023 12-month ECI growth rates by occupation show a strong convergence.
Post-COVID-19, there was a marked divergence in private sector total compensation growth across occupational groups (Chart 5). In particular, compensation growth for service occupations and sales and office occupations (the two lowest paid occupations groups) saw a dramatic rise. This impact of the recession has now subsided. Recent growth rates for total compensation by occupation show a pronounced convergence, reaching the lowest level of variance since 2001.
Chart 5
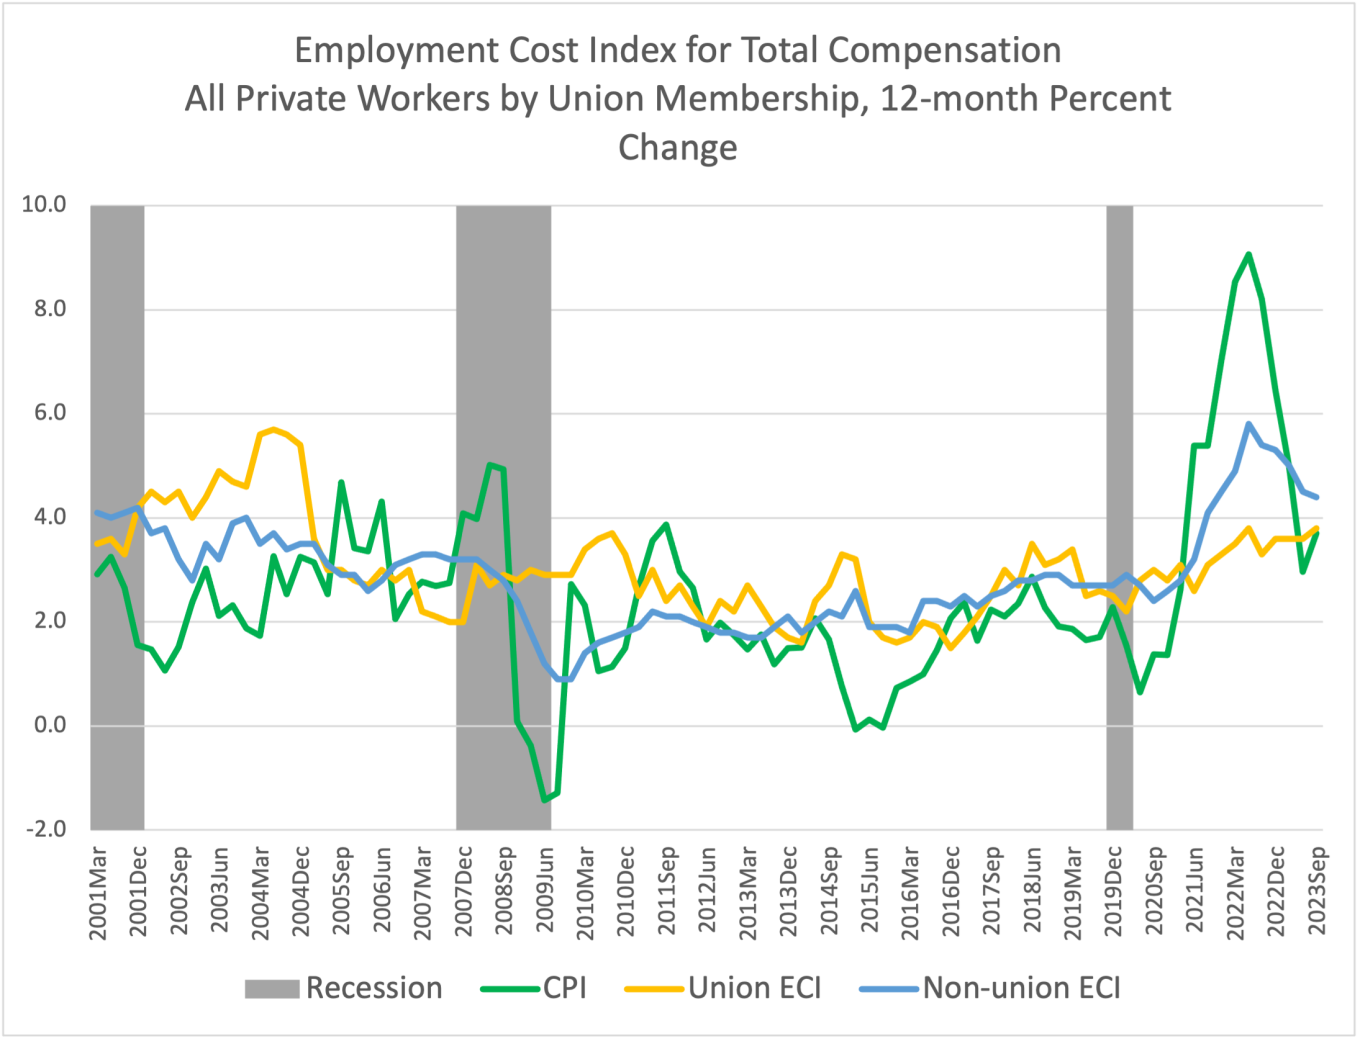
Post-COVID-19 recession, total compensation growth for union workers has lagged that of non-union workers.
Total compensation by union membership shows that the private sector compensation growth rate after the Covid19 recession has been faster for non-union workers compared to union workers, which is different from the pattern after the 2001 and 2007 recessions (Chart 6). After the two previous recessions, compensation growth for non-union workers dipped along with inflation. Notably, inflation accelerated in the aftermath of the COVID19 recession. Since non-union wages are more flexible that those covered by multi-year union contracts (especially since few union contracts have cost of living adjustments), non-union compensation could rise more rapidly to adjust to changes in the cost of living and the tight labor market. Thus, union contracts likely constrained compensation growth in that sector until the contracts expired. Consequently, compensation growth is still rising the union sector even thought it is declining elsewhere.
Chart 6
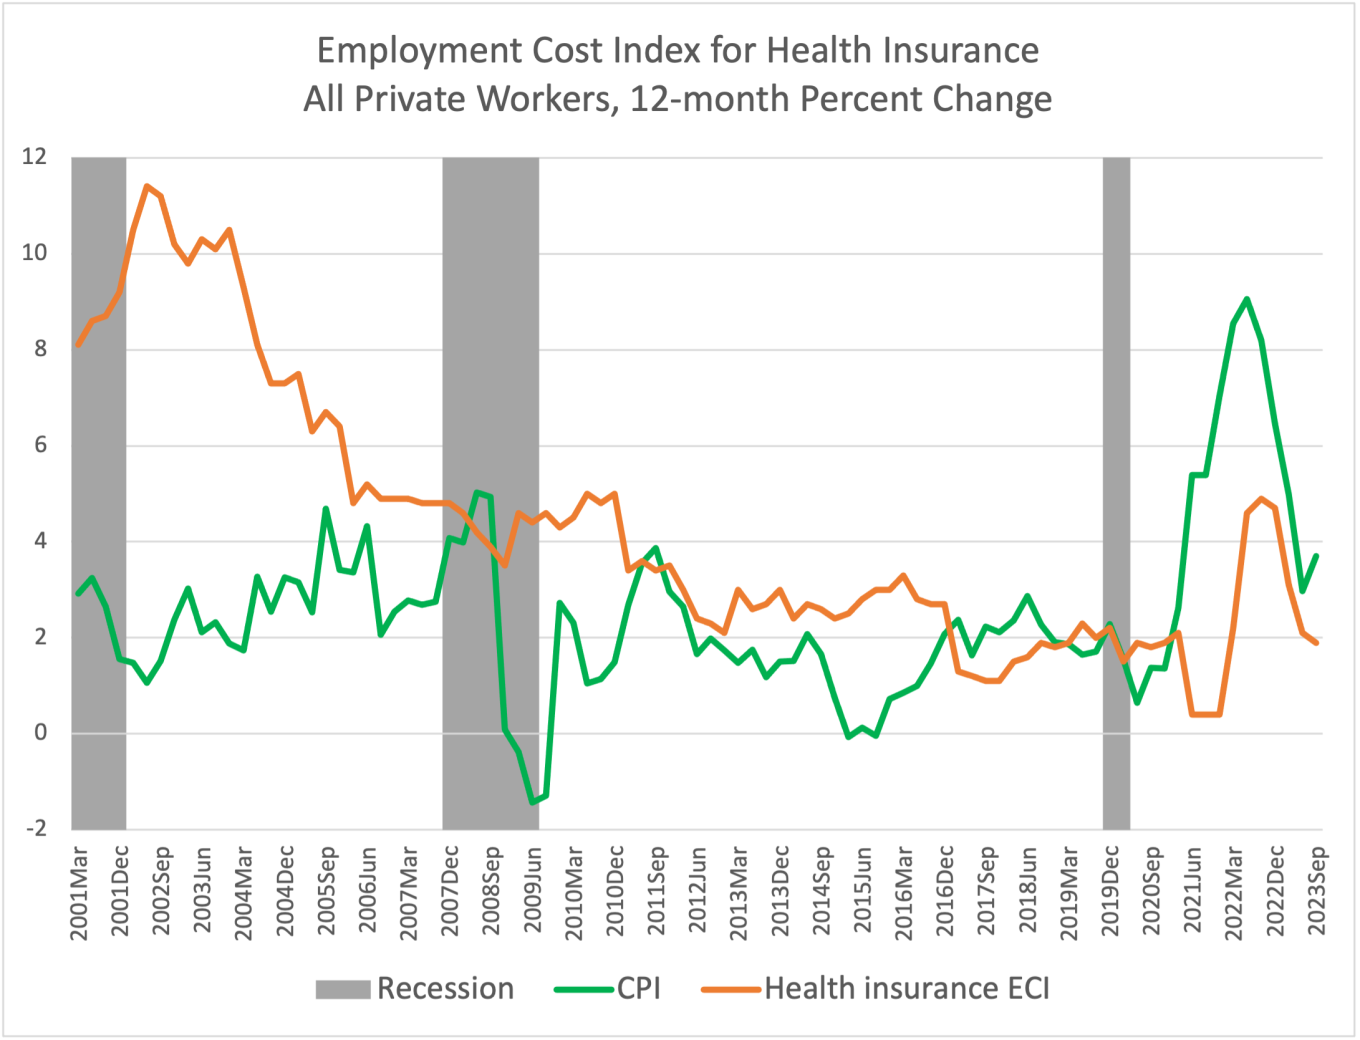
Post-COVID-19 recession, health insurance benefit costs have grown more slowly than inflation.
After the COVID-19 recession, the growth rate of private sector health insurance benefit costs has been consistently lower than the CPI (Chart 7). This contrasts with the pre-COVID-19 pattern when the growth rate of health insurance benefit costs was either higher or at least on par with the inflation rate.
Chart 7
Employment Cost Index (ECI) releases from the U.S. Bureau of Labor Statistics measure trends in the costs to employers for the total compensation, wages, and benefits they provide to their workers, controlling for composition of the workforce. The ECI is one of the labor market indicators used by the Federal Reserve Board to monitor the effects of fiscal and monetary policies and is released quarterly with a one-month lag.
Link to most recent ECI release: https://www.bls.gov/news.release/eci.toc.htm.