


2019 Second Quarter: With unemployment rate steady, year-on-year compensation growth softens
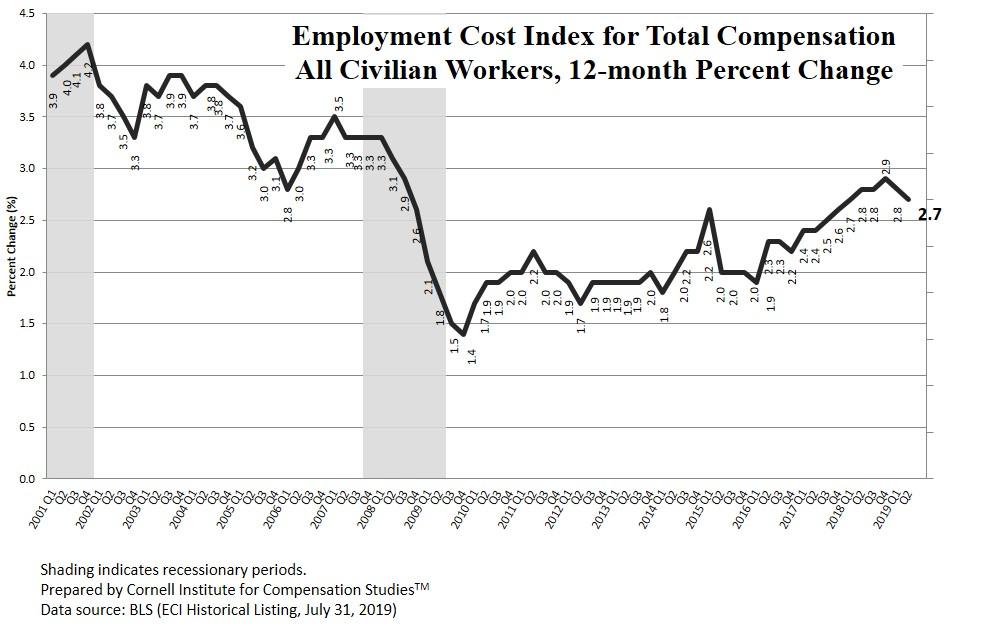
Released July 31st 2019, the U.S. Bureau of Labor Statistics’ 12-month Employment Cost Index (ECI) decreased slightly in the second quarter of 2019, slipping to 2.7 percent, the second quarterly decline in a row. “This drop represents the first time the trend has experienced two consecutive periods with declining growth over the past four years,” says Hassan Enayati, Assistant Executive Director of Cornell’s Institute for Compensation Studies in the ILR School. The positive news for workers is that this quarter’s 12-month ECI is 1.1 percentage points higher than the general price inflation experienced by urban consumers over the past year. The 12-month inflation rate currently stands at 1.6 percent.[1]
The current reduction in the growth rate of employers’ cost for total employee compensation is driven by slowing growth in the cost of total benefits. Year-on-year, benefits costs for all employees were up 2.3 percent in June 2019, compared to the faster growth rate of 2.6 percent in March.
Interestingly, in the private sector, employer costs for employee benefits rose by a slower 1.8 percent in June 2019, compared to a growth rate of 2.4 percent in March. At the same time, employee health benefit costs for private-sector employers rose faster by 0.4 percentage points (from 1.9 percent to 2.4 percent), Enayati notes, “This is the first quarter where 12-month inflation in health benefits exceeded two percent since Q4 – 2016.”
Looking at private-sector employees, those in sales-related occupations, who face the greatest year-on-year volatility in total compensation growth rates, experienced a second quarter of slowing compensation growth. After peaking at a 12-month growth rate of 4.2 percent in Q4 -2018 (the second highest level in over 50 quarters), total compensation for private-sector employees in sales and related occupations dropped to 3.4 percent in March and again to 3.0 percent in June. Likewise, total compensation growth for professional occupations also continued a pattern, albeit gentler, of declining growth. “Prior to the recession, the professional group was one of the groups with the highest ECI growth, but they have had the lowest ECI growth since Q2 – 2016,” says Enayati.
The accelerating growth in employer costs for employee compensation in the public-sector has plateaued this quarter at 3.0 percent – the highest growth rate since the end of the recession in Q3 – 2009. “The strong compensation growth for public-sector employees is being driven by the speed of total benefit cost increases,” notes Enayati. The recent ECI growth of total benefits has also been stronger in the public-sector than in the private-sector.”
______________________________________________________________________
The Employment Cost Index (ECI) released July 31st 2019 by the U.S. Bureau of Labor Statistics reflects trends in the costs to employers for the total compensation, wages, and benefits they provide to their workers. The ECI is one of the labor market indicators used by the Federal Reserve Board to monitor the effects of fiscal and monetary policies and is released quarterly. (See https://www.bls.gov/news.release/pdf/eci.pdf.)